S&P 500 Futures Face Triple Threat: Iran Escalation, FOMC, and Triple Witching Collide March 16-21
Weekend escalation in the Iran conflict has completely reshaped the risk landscape heading into one of the most consequential weeks of 2026. With missiles striking Tel Aviv, US military bases under attack, six American service members killed, and the President openly refusing to negotiate, Monday opens under a cloud of geopolitical uncertainty that the market has barely begun to digest.
What makes this week particularly dangerous for equity markets is the collision of escalating military conflict with a packed central bank calendar. The Federal Reserve delivers its rate decision Wednesday alongside updated economic projections. PPI data drops the same morning. VIX options expire Wednesday. And the week culminates with March Triple Witching on Friday. Any one of these events would demand attention on its own. Together, they create a volatility cocktail that could define the next several weeks of price action.
A War That Keeps Widening
Iran’s Revolutionary Guard launched what it called “wave 52” over the weekend, a coordinated barrage targeting Israeli industrial zones in Tel Aviv, a US forces gathering point in Erbil, and three additional American installations across the region. The scope of these strikes marks a clear expansion of the conflict beyond its earlier boundaries. This is no longer a contained exchange between Israel and Iran. It now directly threatens Gulf allies and US naval assets.
The most alarming development came from Iran’s Khatam al-Anbiya Headquarters, which publicly designated the USS Gerald Ford carrier group in the Red Sea as a threat and warned that logistics centers supporting it would be treated as legitimate targets. In an unprecedented step, Iranian authorities instructed residents near US military installations in Dubai and Doha to evacuate, citing imminent strikes. A drone also hit the Lanaz refinery in Erbil, though the resulting fire was contained.
From the White House, the signal was unmistakably hawkish. On NBC, President Trump declared Kharg Island “totally demolished” and suggested additional strikes “just for fun.” He told the Financial Times that Iran has been “essentially decimated,” claiming the country has “no navy, no anti-aircraft, no air force.” The White House separately told Fox News it plans to refill the Strategic Petroleum Reserve “once war on Iran is complete,” language that implies a sustained campaign rather than a quick resolution.
Diplomatically, the picture looks fractured. The WSJ reported Sunday that Washington plans to announce a coalition for escorting ships through the Strait of Hormuz, but allied support remains thin. Trump publicly criticized the UK for declining to participate. Meanwhile, he pressured China directly, pointing out that Beijing gets 90% of its oil through the Strait. France’s Macron spoke with Iran’s president about a nuclear framework, but Tehran has little incentive to negotiate under active bombardment. The euro slid to a 7.5-month low at $1.1409 against this backdrop.
The Economic Backdrop: Stagflation Fears Meet a Packed Calendar
Monday’s economic calendar carries its own weight, even without the geopolitical overlay. The NY Fed Manufacturing Index arrives at 08:30 ET with expectations of a sharp decline to 3.9 from last month’s 7.10 reading. Industrial Production follows at 09:15 ET, expected at just 0.1% month-over-month versus the previous 0.7%. These numbers matter because they speak directly to the stagflation thesis: an economy that’s decelerating while inflation remains stubbornly elevated from the energy shock.
Treasury Secretary Bessent meets China’s Li Feng on Monday, a meeting that could generate trade headlines. The market’s attention is squarely on the Middle East right now, but any escalation on the tariff front would layer additional uncertainty onto an already fragile risk environment.
The real event risk, though, sits on Wednesday. The Federal Reserve delivers its rate decision alongside updated economic projections and dot plot at 14:00 ET, followed by Powell’s press conference at 14:30 ET. Producer Price Index data drops the same morning at 08:30 ET. VIX options expire that afternoon. The market is currently pricing roughly 35 basis points of easing by year-end, with the first full cut anticipated around October. The implied rate path has shifted notably more dovish over the past month, now projecting rates down to approximately 3% by January 2027.
The question Powell will face is whether the Fed views the oil-driven inflation spike as transitory or structural. If the updated projections acknowledge stagflation risk while the committee holds rates and flags higher inflation from energy costs, that’s arguably the worst-case outcome for equity markets. Friday closes the week with March Triple Witching, creating a volatility bookend that could amplify any directional move established earlier in the week.
Under the Surface: Options Flow and Dealer Positioning
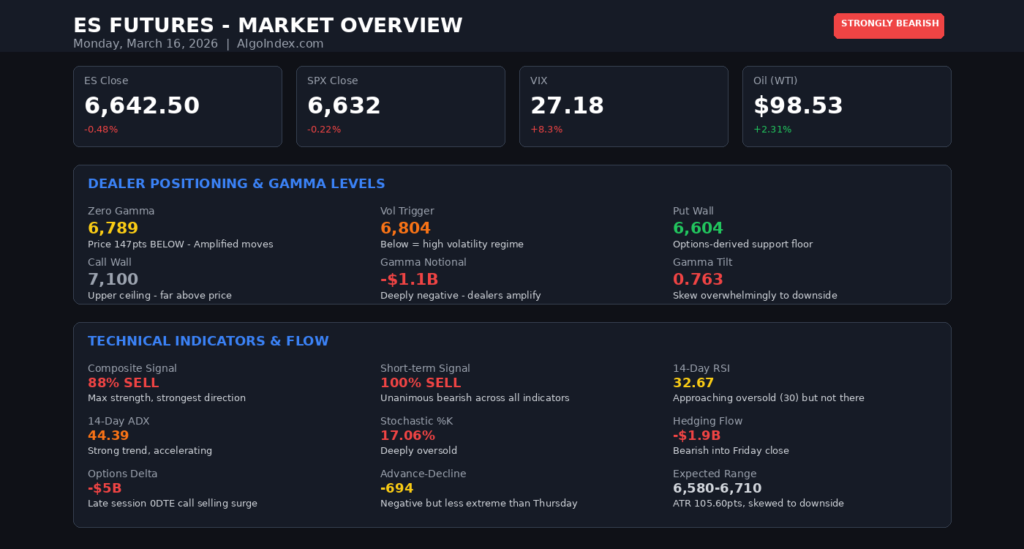
The derivatives market is painting a more ominous picture than the cash market. Friday’s real-time hedging flow registered -1.9 billion on the day, driven by approximately -3 billion in call selling and +1 billion in put selling. The session was relatively quiet until 2:45 PM ET, when a surge of same-day call selling pushed the cumulative delta from roughly flat to -5 billion. The S&P 500 followed the flow and reached session lows at 6,625.
The 30-day range on that hedging flow measure spans -4.4B to +8.2B. Friday’s close near -2B sits in the lower quartile but isn’t extreme, which means there’s room for further deterioration Monday. The gap between mildly negative market internals (advance-decline at -694, volume indicators near zero) and the deeply negative options flow is telling: the aggressive positioning is happening in derivatives, not cash, which is typical ahead of event-heavy weeks.
Noteworthy institutional activity included roughly 12,000 VIX June 21 calls traded at $4.72 ahead of Wednesday’s VIX expiration, and bearish positioning in NVDA continued with 2,200 contracts of January 2028 $180 puts at $38.95. These are hedges being extended, not unwound. The smart money is buying insurance, not taking it off.
Technical Structure Across Timeframes
Price remains below every major moving average: the 5-DMA at 6,753.90, 20-DMA at 6,880.08, 50-DMA at 6,954.36, and 100-DMA at 6,941.56. Only the 200-DMA at 6,750.68 sits relatively close. The distance from these averages underscores how technically damaged the structure has become — any recovery attempt needs to climb a wall of overhead supply.
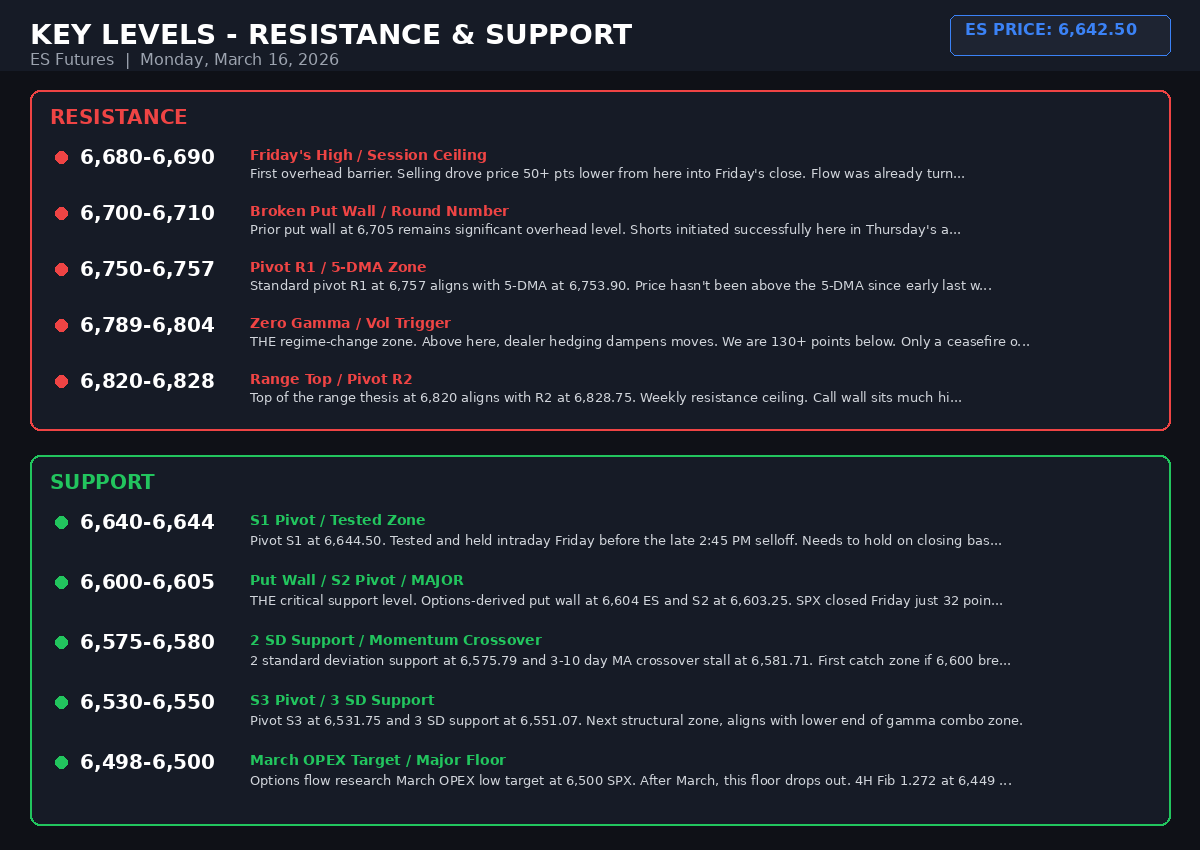
Key Resistance Levels
Key Support Levels
Monday Session Forecast
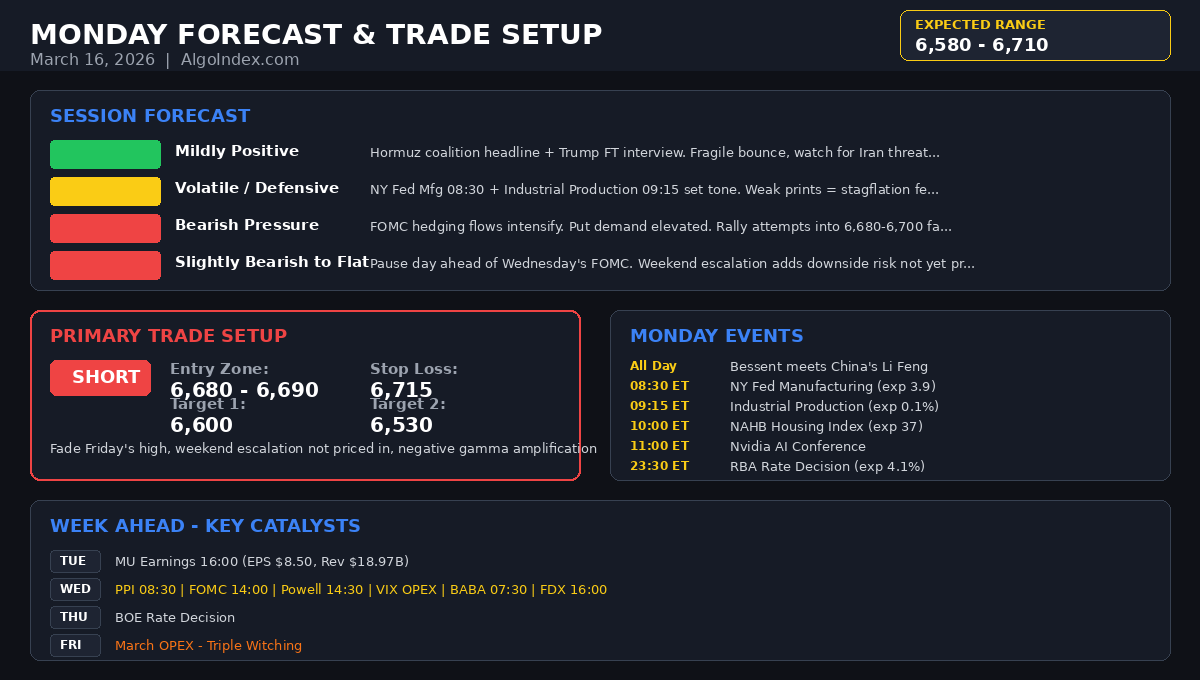
Most Likely Path Detail: Flat to slightly lower open around 6,640-6,660. If the coalition escort headline holds sentiment, expect choppy action between 6,630 and 6,680 through the morning. If fresh Iran headlines break (Dubai/Doha attack, Gerald Ford targeted), look for a flush toward 6,600 or below. Any rally toward 6,690-6,710 gets faded as it runs into Friday’s high and the broken support-turned-resistance zone. Afternoon positioning ahead of Wednesday’s FOMC adds selling pressure into the close.
Monday’s Calendar
08:30 ET — NY Fed Manufacturing Index (exp 3.9, prior 7.10)
09:15 ET — US Industrial Production MoM (exp 0.1%, prior 0.7%)
09:15 ET — US Capacity Utilization (exp 76.2%, prior 76.2%)
10:00 ET — NAHB Housing Market Index (exp 37, prior 36)
11:00 ET — Nvidia AI Conference
23:30 ET — RBA Rate Statement / Cash Rate (exp 4.1%, prior 3.85%)
The Week Ahead
Wednesday is the week’s inflection point: PPI at 08:30 ET, then FOMC at 14:00 ET with updated projections, followed by VIX expiration. Micron (MU) reports Tuesday at 16:00 ET (EPS $8.50, Rev $18.97B), particularly relevant given the helium supply chain disruption from Qatar’s Ras Laffan shutdown. Alibaba (BABA) reports Wednesday at 07:30 ET (EPS $1.73, Rev $41.26B), and FedEx (FDX) on Wednesday at 16:00 ET (EPS $4.11, Rev $26.46B) as a bellwether for global trade and shipping costs. The week culminates with March Triple Witching on Friday.
Our Read: Strongly Bearish Below 6,700
The thesis is unchanged and reinforced by weekend escalation. The war is widening, not narrowing. Every bear case from last week played out, and the catalysts have gotten worse. Bounces toward 6,680-6,700 remain short opportunities. Friday’s options flow showed heavy selling kicked in at exactly these levels, and the negative gamma regime amplifies any move through this zone.
The key question for Monday is whether 6,600 holds. The institutional consensus still calls this the floor of the current range (6,600-6,820). A close below 6,600 opens the path to 6,500, which is the March expiration target. With Triple Witching on Friday and the FOMC on Wednesday, the catalysts to break it are present.
If Iran follows through on threats to hit Dubai or Doha, or targets the Gerald Ford carrier group, expect a VIX spike above 30 and a flush through 6,600 toward 6,530-6,500 in a single session. That’s not the base case, but it’s a real scenario this week.
The only bull case remains a sudden de-escalation: ceasefire, Strait of Hormuz reopening, or a decisive military conclusion. The volatility premiums at roughly 20 points are so wide that any such headline would trigger a violent squeeze. But nothing in the weekend headlines suggests this is imminent.
Monday is a pre-positioning day ahead of the real fireworks Wednesday. The market needs to digest the weekend escalation, recalibrate risk, and begin hedging for FOMC. Expect elevated volatility, wide spreads, and institutional de-risking. The trend remains your friend until Iran resolves.
This analysis is for informational and educational purposes only. It does not constitute financial advice. Always do your own research and consult a licensed financial advisor before making investment decisions.
Related Articles

Is a Major Market Correction Really a Concern? (Playbook – Part 2)
A Practical Guide to Spotting Regime Change—and Acting Before Everyone Else AlgoIndex Research | November 2025 Markets don’t crash only because prices are high. They crack when expensive and crowded meets tightening financial conditions. That’s the intersection this playbook is built for. Below we translate today’s risks into a simple operating map: what to watch […]

Is a Major Market Correction Really a Concern?
What Buffett, Burry, and the Data Actually Say About Today’s Fragile Markets AlgoIndex Market Analysis | November 2025 The screens have started to look familiar again: red across the indices, breathless posts about “the big one,” and viral charts warning that it’s “not the time to buy the dip.” In recent days, two headlines in […]