Articles tagged "Options Flow".
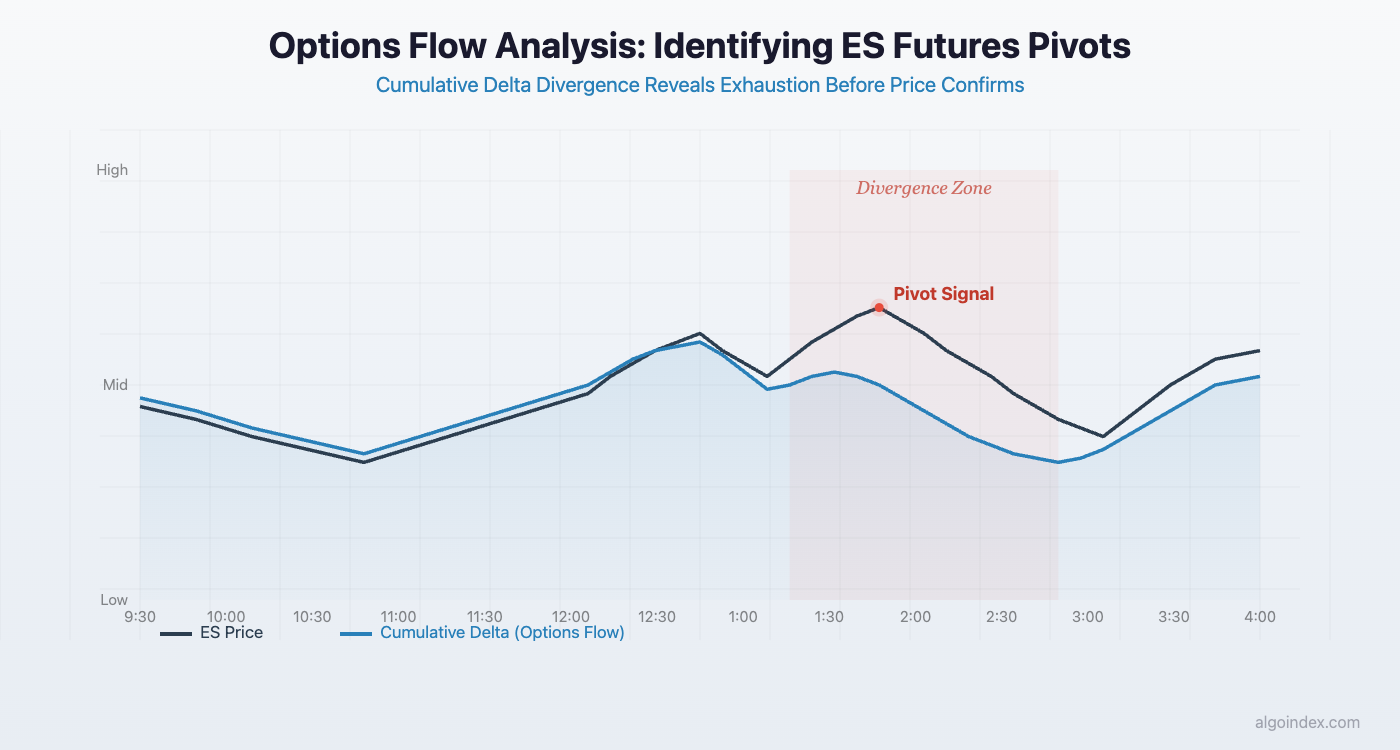
How institutional options flow signals ES futures pivots before they appear on charts. Includes real-time reading techniques.
ES broke the 200-DMA for the first time since October as missiles struck near Israel's nuclear facility. Hormuz blocked three weeks, $93.9B gamma expired, WTI at $100.
FOMC rate decision day with $2.2B institutional delta shift and VIX expiration creating two-phase ES futures setup. Gamma levels, options flow, and key zones for March 18, 2026.