image
Options flow analysis chart showing cumulative delta divergence on SPX futures

How Options Flow Analysis Helps ES Futures Traders Find Pivots

Categories: Market Outlook
March 28, 2026 by AlgoIndex
undefined

Frequently Asked Questions

What is options flow analysis for ES futures?

Options flow analysis tracks institutional buying and selling of options contracts in real-time. For ES futures traders, monitoring SPX options flow reveals where large participants are placing directional bets, hedging risk, or building positions – often signaling price pivots before they show up on the futures chart.
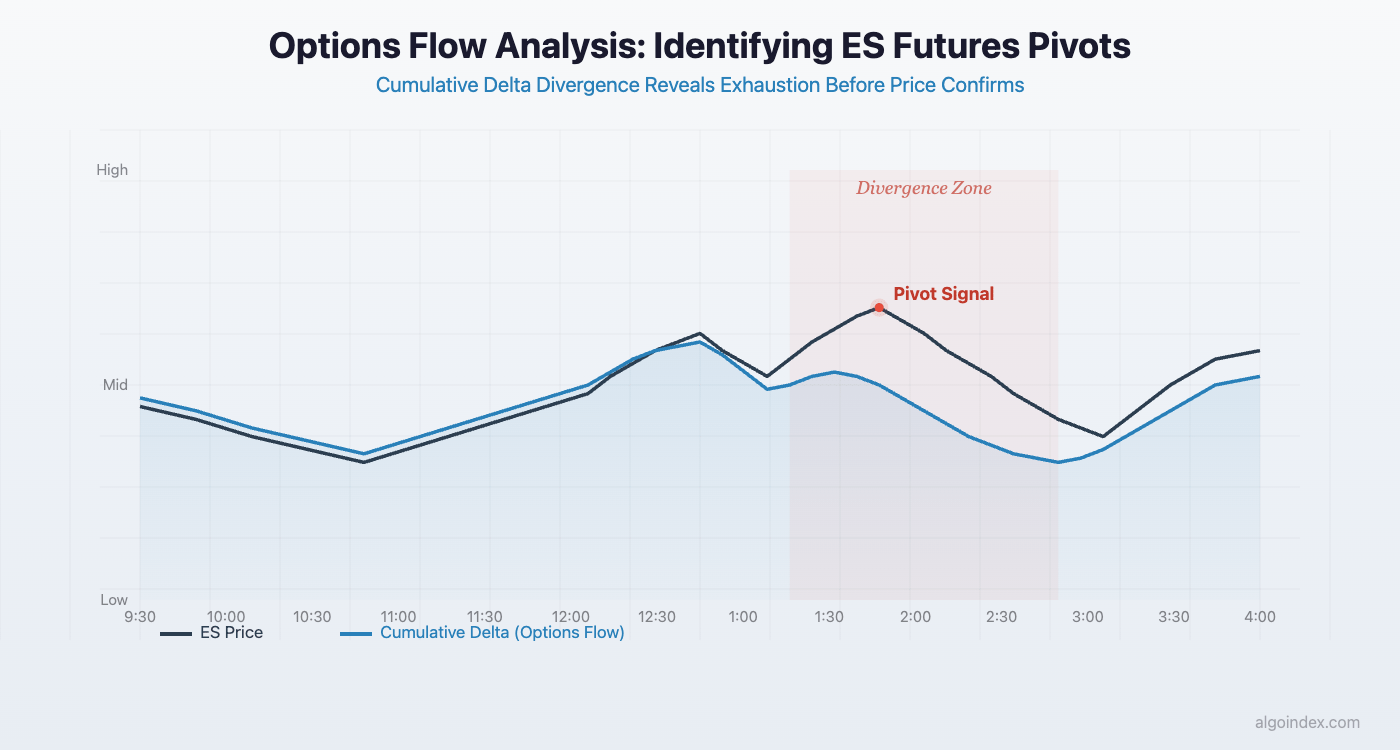
How does HIRO help identify ES futures pivot points?

HIRO (Hedging Impact Real-time Overlay) tracks cumulative customer delta from options trades during regular trading hours. When HIRO diverges from price action – for example, HIRO flattening while ES keeps rising – it signals that options flow is exhausting, and a reversal is likely forming. This divergence at key gamma levels provides the highest-conviction pivot signals.

What is the difference between 0DTE and longer-dated options flow?

0DTE (zero days to expiration) flow represents same-day options trades that are highly reactive and short-term – these generate large immediate dealer hedging impacts but are prone to reversal. Longer-dated flow (weekly, monthly expirations) represents more deliberate institutional positioning with higher conviction and more stable price effects.

When is options flow data most reliable for ES futures trading?

Options flow is most reliable during the New York AM session (9:30-11:30 ET) when institutional volume peaks, and during power hour (3:00-4:00 ET) when end-of-day positioning accelerates. Flow signals are less reliable during lunch hours (12:00-1:30 ET) due to lower volume, and should not be used outside regular trading hours.

Join the Discussion

Connect with other ES futures and SPY options traders. Share setups, discuss levels, and get real-time market insights from our community.

Join AlgoIndex Trading Community

Related Articles

NQ futures Nasdaq 100 E-mini trading guide with contract specifications and price action analysis

What Are NQ Futures? Nasdaq 100 E-mini Trading Guide

$20 Per Point (NQ) 250-400 pts Typical Daily Range 23.5 hrs/day Trading Access At 3:58 PM on a Wednesday in late January, Nvidia’s earnings release hit the wire. Within 90 seconds, NQ futures moved 300 points, roughly $6,000 per contract, while ES barely flinched beyond 40 handles. That gap between the two instruments tells you […]

Read More
ES Futures CPI Day Setup April 10 2026 - Key Levels Gamma Architecture AlgoIndex

ES Futures: The 0DTE Mirage Meets CPI Reality

Market Outlook • April 10, 2026 ES Futures • S&P 500 E-mini • CPI Day Setup +75 pts Session Rally +$6.3B Hedging Delta 25K 0DTE Calls 3.4% CPI Est. YoY Between the moment Israel announced ceasefire talks and the moment 25,000 SPX 0DTE calls crossed the wire, ES futures surged 75 points in a single […]

Read More
S&P 500 (ES) Futures: Ceasefire Euphoria Masks Institutional Distribution Before Triple Data Release (April 9, 2026)

S&P 500 (ES) Futures: Ceasefire Euphoria Masks Institutional Distribution Before Triple Data Release (April 9, 2026)

ES Close 6,817.25 +160.50 (+2.41%) VIX Crush -17.46% 21.27 (from 25.77) Oil Crash -15.10% $95.89 (ceasefire pricing) Flow Divergence -$3B Midday flow extreme ES RTH Close 6,817.25 +160.50 (+2.41%) Day’s Range 195 pts 6,652.25 – 6,847.25 VIX 21.27 -4.50 (-17.46%) Crude Oil (WTI) $95.89 -$17.06 (-15.10%) Gold $4,754.50 +$69.80 (+1.49%) DXY 98.99 -0.525 (-0.53%) Between […]

Read More