
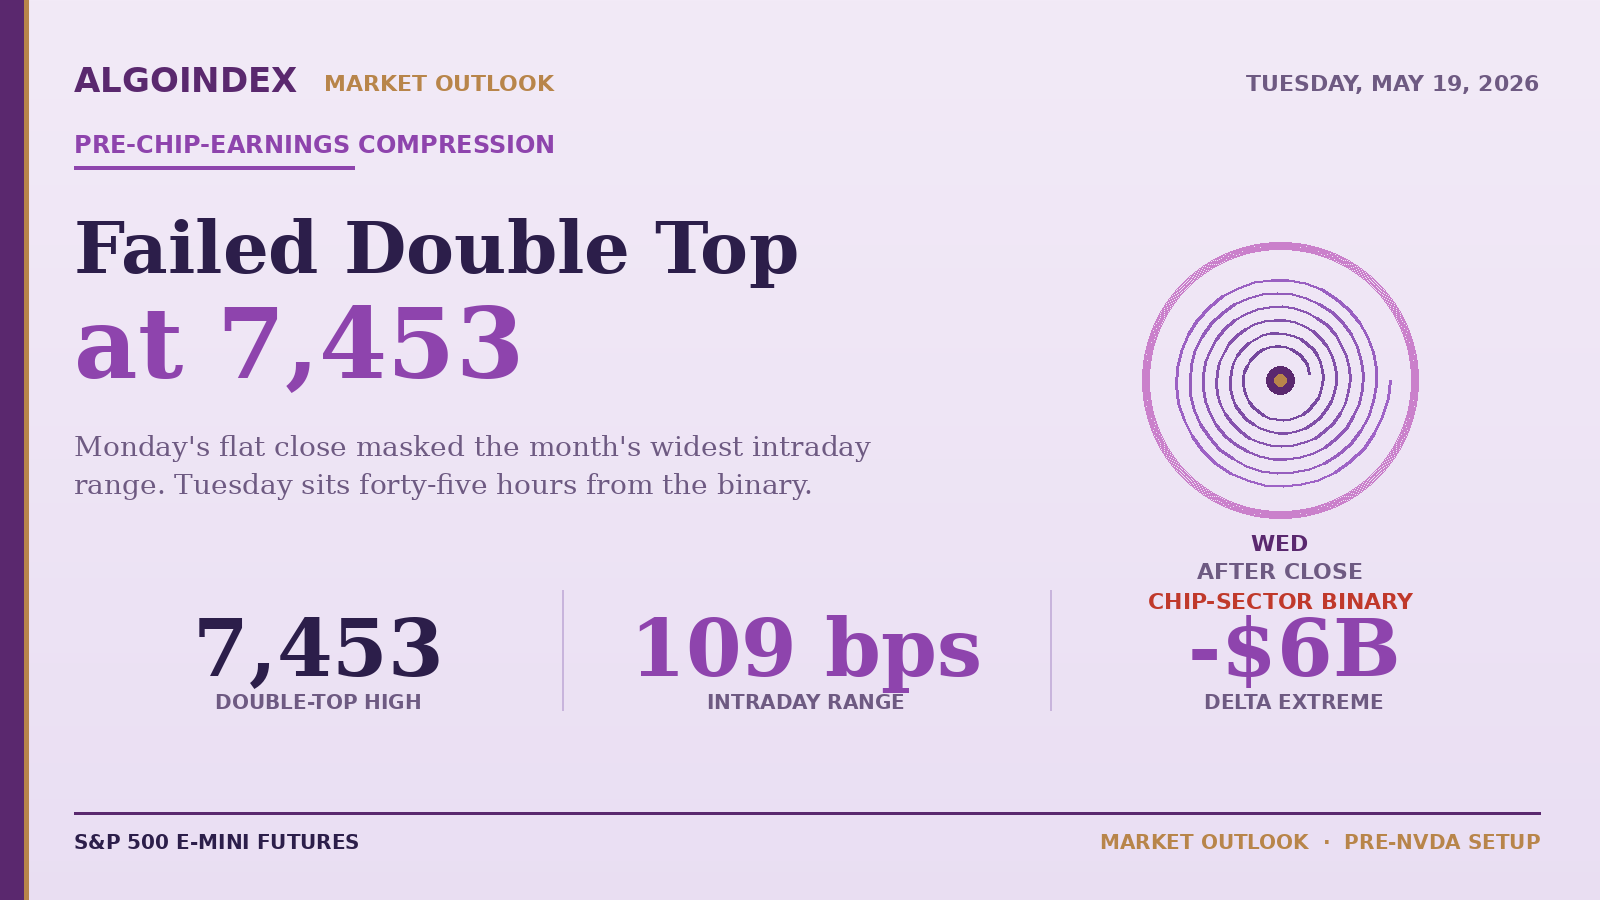
At 9:46 AM Monday, S&P 500 cash touched 7,453. Ten minutes later it touched 7,453 again. Both prints were rejected within the same five-minute candle, both at the strike where institutions had written the morning's largest concentration of zero-day-to-expiration short calls. By the close, the index had returned to 7,403.04. By every standard measure of session direction, Monday was flat. By every standard measure of intraday movement, it was the most violent session of the month.
Three hours separated the second 7,453 print from the day's low of 7,375. In that window, the real-time options-delta reading swung from positive territory to a negative six-billion-dollar deficit and back to flat by the close. Crude oil priced 99.53 at the morning open, ripped to 102.34 by 11:00 AM on Iran headlines that flipped from a sanctions-waiver leak to an Iranian source rejecting the proposed terms, and then settled at 102.45 into the bell. The S&P 500 closed at $7,403.04, down 0.07 percent. The closing TICK printed plus-9,902 from market-on-close buy imbalances. Net advancing volume printed positive after spending most of the morning negative. The chart shows a doji. The session was anything but.
That gap between the flat close and the violent intraday range is the structural read going into Tuesday. Positive dealer gamma did its job. Every push toward the 7,453 ceiling was sold by institutions writing fresh upside short calls, and every test toward the 7,386 IRON pivot was bought by dealers defending their put-side exposure. The result was a 109-basis-point range that round-tripped twice. Tuesday inherits the same structure plus three new constraints: the VIX cash settlement prints at 9:30 ET (settlement noise), Federal Reserve member Waller speaks on the rates outlook, and the entire week's directional bias is captive to Wednesday's chip-sector earnings event that resolves the dispersion-trade hedges institutions have been layering for three sessions.
Monday's mechanical recap
The opening session was constructed on a constructive Iran narrative. A 7:39 AM headline from the news service reported that the United States had proposed a temporary waiver on Iran oil sanctions. At 8:35 AM, an Al Arabiya leak reported that Iran wanted a long, multi-stage truce including a long-term nuclear freeze rather than full dismantling. Both releases were tagged as risk-on. Equity-index futures rallied 64 points from Sunday's 7,382 low to a pre-RTH peak of 7,446. A second wire confirmed Beijing-Washington tech-deal progress: He Lifeng met AMD's chief executive at 8:56 AM, and the White House confirmed China will buy at least seventeen billion dollars in US farm goods annually.
The reversal came at 10:13 to 10:21 AM. A Tasnim wire cited an Iranian source close to negotiations who said the US demands "remain excessive despite draft changes" and that Iran would not, under any circumstances, trade the war's end for nuclear concessions. Oil ripped from 99.53 to 102.34 in three quarters of an hour. The S&P 500 cash index rejected 7,425 twice within ten minutes, both at the strike where institutions had stacked their short-call concentration. By 11:00 AM, order-flow data showed cumulative volume delta collapsing from positive 4,755 to positive 2,055 in thirty minutes, the order-book imbalance flipping from plus-9 percent buy-side to minus-10 percent buy-side, and a fresh 180-contract offer wall building at ES 7,422.5.
The recovery into the close was driven by three forces working in concert. Positive dealer gamma created an automatic mean-reverting bid every time price tried to break below 7,386. Oil rolled over from 102.34 back to 102.45 close, still up on the day but well off the intraday peaks. And the market-on-close buy imbalance lifted internals into the bell. The 109-basis-point range with a flat close is the characteristic positive-gamma fingerprint. Institutions writing fresh short calls every time price approached the upper rail and writing fresh short puts every time price approached the lower rail produce exactly this outcome.
The 7,453 ceiling is where Tuesday's setup begins
The failed double top at SPX 7,453 is the cleanest read on the institutional call-selling concentration of the past week. Two distinct four-hour candles tagged that level, both with upper wicks, both with closes back inside the range. The four-hour structure has a fresh double top that needs to be invalidated for upside continuation. The four-hour fifty-period exponential moving average sits at approximately 7,418 and Monday closed at 7,427, which places the index at the structural decision level for the week.
The one-hour chart carved a tight compression range between 7,415 and 7,450 for most of the regular trading hours session, with the two failed pokes at 7,450 followed by a controlled fade and end-of-day recovery. The one-hour twenty-one-period exponential moving average acted as resistance every time price tagged it from below in the morning session, then flipped to support in the afternoon as the index reverted to the mean. The momentum oscillator rolled over from morning overbought near 75 to mid-range near 50. The structure is mid-range neutral, not extended in either direction. The one-hour VWAP closed at approximately 7,425, which aligns exactly with the Pivot Point at 7,420.
The session value area centered tightly at 7,420 to 7,430 ES, a single-bar value-area distribution that suggests Tuesday opens with similar gravitational pull to the 7,420 area. Three distinct double bottoms at 7,418 ES through the session suggest institutional demand layered defensively at that level. The fifteen-minute chart spent the day inside the 7,415 to 7,435 order-book defined range, with the two volatility spikes to the 7,375 low and the 7,453 high. The fade-the-extremes day pattern was clean: every time price extended outside the 7,415 to 7,435 box, it reverted within three to five candles. The 7,415 ES bid wall built from 65 contracts in the morning to 124 contracts by mid-session as institutional demand layered in defensively.
What the institutional call-selling pattern actually means
The closing options-flow data carried a striking pattern: heavy call selling across the index complex into the bell. ES 7,450 calls expiring Tuesday sold below the bid repeatedly. ES 7,435 expiring Tuesday calls sold. SPY 736, 737, 738, and 741 calls sold across multiple expirations from one-day-to-expiry through May 29. TSLA 415, 422, and 500 calls sold. The pattern is institutions willing to write upside calls at current levels because they see positive dealer gamma plus the chip-sector earnings overhang capping the rally short-term.
LEAPS bullish positioning remained intact in single names. The tech-leader received thirty-seven million dollars of January 2027 260-strike call premium. The same name received thirty-five million dollars of January 2028 300-strike call premium. The software leader received thirty-two million dollars of August 2026 390-strike call premium. The communications-platform name received twenty-four million dollars of January 2028 180-strike call premium. But the QQQ thirty-two-million-dollar put for the December 2028 650 line is a sizable long-term tech hedge that fits the dispersion narrative: short index, long single names, hedge the index with deep out-of-the-money long-dated puts. Yesterday's article tracked the same dispersion-trade signature ahead of the Iran/Hormuz overnight breach; Monday's call-selling concentration confirms the structure has not unwound.
Three notable institutional flows from the prior-session real-time hedging-flow report warrant explicit follow-up. The volatility-index calendar call rolled out to an August 35 strike (deep out-of-the-money August hedge). A high-grade-credit ETF saw forty-thousand of July 106-strike puts ratioed against 103-strike puts paid for approximately one million dollars of premium. The small-cap ETF saw fifty-five-thousand May-20 expiration 265-strike puts versus 275-strike puts paid for nine million dollars of premium. That last bet has only two trading days to expiration. If held overnight into Tuesday, small-caps trade under pressure and the equity-index complex follows in sympathy. The position is worth confirming on intraday data Tuesday morning.
The pre-NVDA dispersion-trade is the structural overhang
The week's dominant flow is the dispersion-trade signature. Institutions are short the index via deep out-of-the-money put hedges and short upside calls into the gamma-defense zone. They are simultaneously long specific single names through LEAPS bullish positioning. They are long credit through the high-yield ETF call concentration. They are long copper through the copper-miner ETF call positioning. The translation is that the index gets sold while specific catalysts get held. Wednesday afternoon's chip-sector earnings is the binary event that resolves the dispersion trade.
The chip-sector implied move on the print is approximately six percent. The dispersion-trade unwind would amplify that into a 1.0 to 1.5 percent S&P 500 spillover, either direction. A strong beat with bullish forward guidance produces an estimated 1 to 1.5 percent SPX gap higher on Thursday's open. A miss or weak forward guidance produces an estimated 2 to 3 percent SPX drop on Thursday's open, which would test the dealer-positioning lower band at 7,310. The Treasury auction at midday Wednesday is the secondary catalyst. The previous 30-year auction tailed above 5.00 percent. A 20-year tail at the same magnitude would amplify the yield path and re-engage the bond-equity correlation that has driven the past three sessions.
Tuesday's session is positioning for that binary, not predicting it. The positive dealer gamma that dampened Monday's range will continue to dampen Tuesday's range. The narrow expected-range projection of 0.63 percent from the dealer-priced model implies a Tuesday band of SPX 7,371 to 7,464. The 14-day average true range allows a wider 7,328 to 7,488. The most likely path is open near 7,425 ES, morning test of either the 7,386 support shelf or the 7,453 ceiling that broke Monday, afternoon de-risk drift toward 7,400, and close in the 7,403 to 7,420 range.
The primary short setup and the iron level
The cleanest trade structure for Tuesday is short on a bounce into the failed double-top zone. The trigger is a morning push into ES 7,455 to 7,465, which corresponds to SPX 7,433 to 7,443. The entry sits on a rejection candle with volume confirmation in that zone. The stop sits at ES 7,478, above the Monday double-top print. The first target is ES 7,442, the Pivot Point. The second target is ES 7,408, the IRON Pivot first-support level at SPX 7,386. The third target is ES 7,385, the second-pivot support at SPX 7,363. Risk to first target runs roughly 1:0.6. Risk to second target runs 1:2. Risk to third target stretches past 1:3.9. The thesis is pre-chip-earnings de-risk plus heavy institutional call-selling at 7,425 and 7,450 stacks the upside.
The secondary trade is a breakdown short on a confirmed fifteen-minute close below SPX 7,386. The entry sits in the ES 7,408 to 7,412 zone. The stop sits at ES 7,425, above the broken support and the 7,400 SPX reclaim level. The first target is ES 7,395, the second target is ES 7,370 (SPX 7,350 dealer-positioning support level), and the third target is ES 7,345 at the 4-week Fibonacci 38.2 percent retracement of SPX 7,323. This setup activates only on confirmed close below SPX 7,386 and carries highest conviction if crude oil simultaneously rallies above 103.
The iron level for Tuesday is SPX 7,386, ES 7,408. The breach of that line on volume opens the path to the SPX 7,310 dealer-positioning lower band. The opposite path requires SPX to reclaim 7,453 with conviction, which would re-engage the relief bounce thesis and target SPX 7,475 to 7,500 Call Wall as the mean-reversion zone. Our performance methodology documents the position-sizing rules that govern major-event weeks. The recommended sizing for Tuesday is half-normal given the volatility expansion and the binary Wednesday print. No swing positions through Wednesday close.
The pin before the storm
Fed Waller speech
Japan GDP digestion
RBA Minutes
ECB Lane + Buch
20Y Bond Auction 1 PM
FOMC Minutes 2 PM
EIA Crude 10:30
NVDA Q1 AMC
Initial Jobless Claims
Philly Fed Mfg
Existing Home Sales
Fed speakers
UMich Sentiment Final
Baker Hughes Rigs
Pre-Memorial Day
Position squaring
The Federal Reserve member speech Tuesday is a rate-market catalyst, the VIX expiration at 9:30 ET is a procedural settlement event with first-thirty-minute noise, and the Japanese first-quarter GDP beat overnight puts a modest bid under risk assets globally. The dispersion-trade carry continues to favor the downside on the index while supporting specific single names. The 20-year Treasury auction at midday Wednesday is the secondary yield catalyst. None of these matters as much as what the chip-sector leader reports after the Wednesday close.
The 7,453 ceiling and the 7,386 support shelf are not technical levels; they are the lines where dealer hedging actively reversed direction. They are also the lines that frame the last forty-eight hours of positioning before the week's binary event resolves the entire setup.
AlgoIndex turns this same level work into automated entries, sizing, and exits across ES, NQ, GC, and CL.
View pricingFoundational guides
New to S&P 500 futures? Start with What Are ES Futures, the ES, NQ, MES & MNQ point value and contract specs, gamma exposure (GEX) explained, and market internals: TICK, ADD, VOLD and VIX.



