
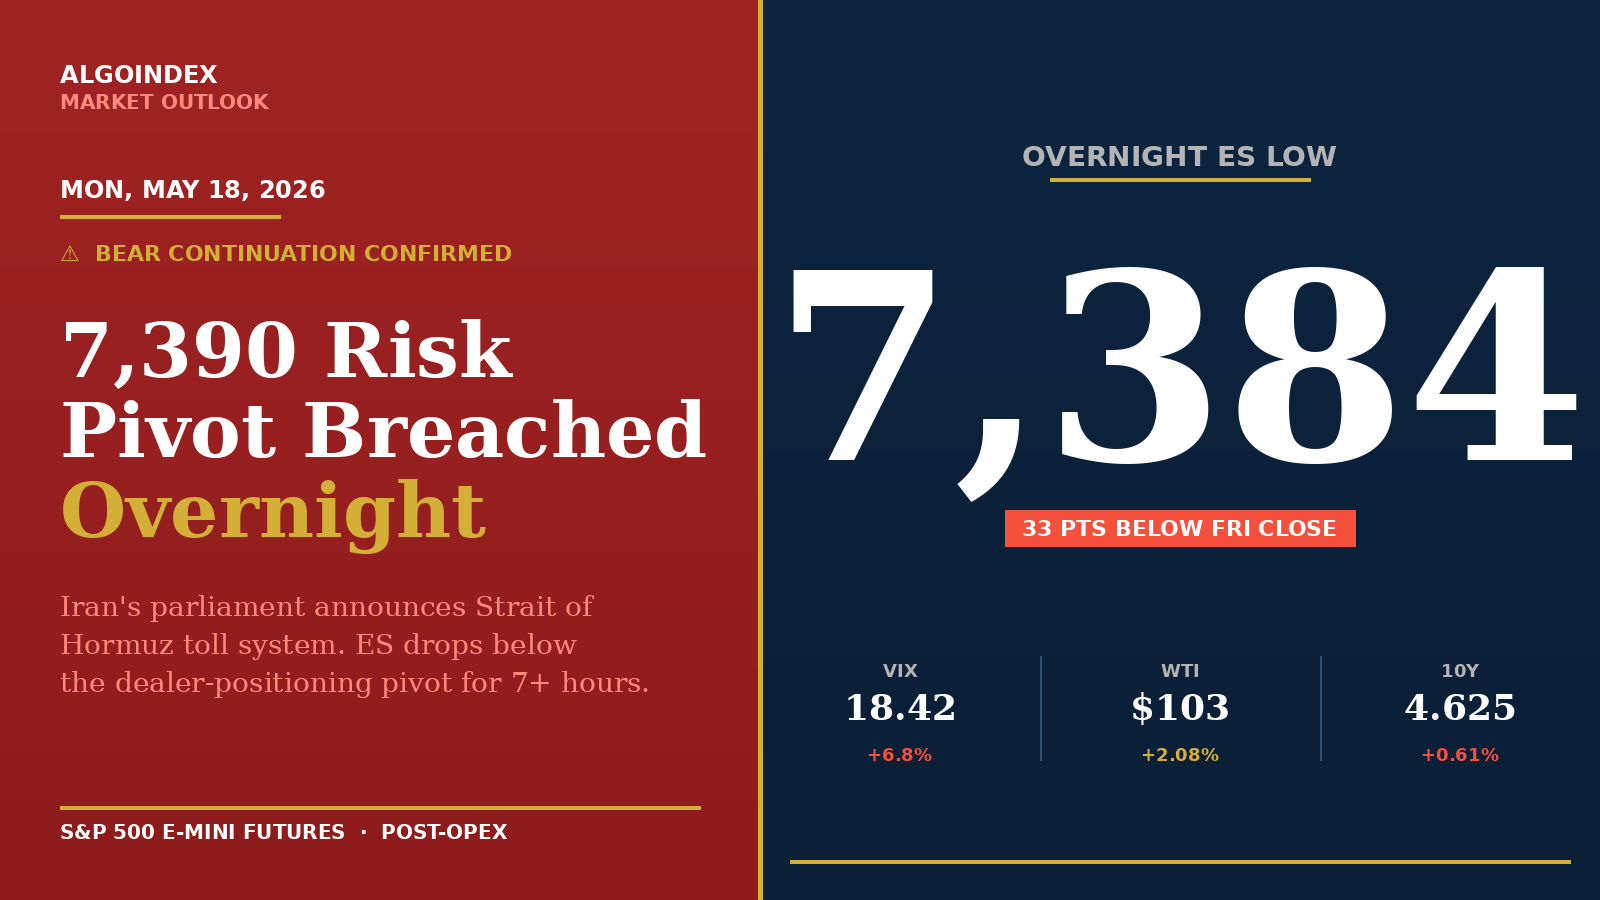
At 1:00 AM Eastern, ES futures printed 7,384.75. The level matters because thirty-three points higher sat the S&P 500 cash close from Friday, and five points higher sat the strike where dealer hedging had defended the index for a month. Between Sunday's 6:00 PM Globex open and that 1:00 AM print, the SPX 7,390 line had been breached and held below for seven straight hours. The catalyst had a name: Iran's parliament national security chief, announcing a system to control commercial traffic through the Strait of Hormuz, with "essential charges to be collected for specialized services under this mechanism."
Twenty percent of the world's oil moves through Hormuz. Within hours of the announcement, WTI crude was bid 2.08 percent higher to $103.12, the 10-year Treasury yield climbed another sixty-one basis points to 4.625, the dollar index pushed to 99.33, and Bitcoin gave back $1,300 from its Sunday-evening level. The cascade was standard in its mechanics and unsentimental in its message. The bear continuation thesis that the prior week's bond shock had set up was no longer hypothetical. It had a fresh catalyst, it had an iron level confirmed broken, and it had four trading sessions to play out before Wednesday's chip-sector earnings event reset the entire setup.
Friday's bond shock was the structural break
The Monday morning move did not emerge from clean air. Friday's session was the structural inflection point. The 30-year Treasury auction tailed above 5.00 percent, the first time since 2007 that the long bond had cleared at that level on a new-issuance auction. The 2-year yield broke above 4.00 percent for the first time in over a year. WTI surged 3.22 percent on the session to $105.25 before easing back to $103. KOSPI dropped 6 percent on Samsung worker strike news. Silver liquidated 9.12 percent in a single session. The semiconductor leader gave back 4.42 percent to $225. The VIX added 6.78 percent to close at 18.42, the largest single-day expansion in two months.
The S&P 500 cash index closed at 7,408.49, down 1.24 percent on the session. That was the largest single-day decline since March. Friday's intraday action was instructive in its own right. The cash open flushed to a 7,397 low by 10:14 AM ET. Real-time options-delta data showed a $7 billion swing reversal as buyers absorbed the morning. The index recovered to 7,430 by midday and pinned there through 2:00 PM. The final ninety minutes broke the pin. Cumulative options delta turned to negative $6 billion by the close. The 7,400 to 7,410 zero-day-to-expiration calls printed a 900 percent gamma squeeze in the final ten minutes, but in the wrong direction. The 7,400 to 7,410 strike concentration flipped from positive to negative gamma at the bell.
What the 7,390 breach actually changes
Before the weekend, the SPX 7,390 strike held dual meaning. It was the dealer-positioning pivot level published Friday at 5:34 PM ET as the line between the bull continuation environment and the bear-side acceleration zone. It was also the 14-day average true range lower-bound projection from Friday's close. The Globex session breached it at the open and stayed below for the entire overnight session. That move is not noise. It is the level that institutional desks had paid to defend, and the catalyst that broke it was a geopolitical event, not a positioning artifact.
The new framework derives from updated computed pivot data refreshed at 1:00 AM ET. The Pivot Point sits at SPX 7,420.28, which is the mean-reversion magnet for any morning bounce attempt. The first-pivot support at SPX 7,385.72 corresponds to ES 7,408, exactly where the overnight low printed. The 4-week Fibonacci 38.2 percent retracement sits at SPX 7,322.99, which becomes the active downside target if the iron level fails on a confirmed break with volume. The 4-week Fibonacci 50 percent retracement sits at 7,263. The major dealer-positioning lower band sits at SPX 7,295. The path from current spot to 7,295 is now mathematically continuous: no major pivot breaks the slope between here and there.
The counter-intuitive read on standard technical signals is worth flagging. A widely-followed multi-indicator composite reading just strengthened to 100 percent buy across all timeframes, up from 88 percent the prior week. Standard technical indicators lag price by definition. The 14-day RSI finally rolled off the overbought 70 zone to 67.34, but the moving-average ladder still shows price above the 5-day, 20-day, 50-day, 100-day, and 200-day moving averages. The structural long trend remains intact on every timeframe except the five-day. The 5-day moving average at 7,433 sits 25 points above Friday's close. The first signal that the longer-term trend is breaking will be a sustained 20-day moving average violation at 7,260. Until then, the bear thesis lives in the macro positioning and the price action, not in the lagging indicators.
The institutional hedge stack confirms the bias
Friday's real-time hedging-flow exec summary documented the institutional bias in detail. Index ETF total delta closed at negative $13.4 billion, which is a 95th-percentile bearish positioning. The single largest options trade of the session was 200,000 SPY 565-strike puts bought for the June 26 expiration, a roughly $20 to $30 million premium outlay on a single crash hedge that prices in approximately a 23 percent drop from spot. The Treasury bond ETF showed 0th-percentile vega, which corresponds to extremely depressed expected bond volatility. The semiconductor ETF showed 98th-percentile vega, which corresponds to extremely elevated expected semi volatility ahead of Wednesday's chip-sector earnings.
The dispersion signature is clean. Institutions are positioned short the index, long specific single names (the chip-sector leader received 42,731 of 250-strike calls bought for the post-earnings expiration), long credit (the high-yield ETF received 132,000 of 81-strike calls bought for the November expiration), and long copper (29,562 calls bought on the copper miner ETF). The translation is that the index gets sold while specific catalysts get held. Wednesday's chip-sector earnings is the binary event that resolves the dispersion trade.
Monday's primary setup and the iron level
The cleanest trade structure for Monday is short on a bounce. The trigger is a morning push back into the ES 7,440 to 7,465 zone, which corresponds to SPX 7,418 to 7,443, the Pivot Point plus the first-pivot resistance band. The entry sits in the 7,445 to 7,455 zone on a rejection candle with volume confirmation. The stop sits at ES 7,470, above the Pivot Point structure.
The iron level for Monday is SPX 7,385, which corresponds to ES 7,407. A confirmed break below that line on volume opens the downside acceleration path to the 7,322 Fibonacci 38.2 percent target. A second break below SPX 7,295 opens the path to the 7,263 Fibonacci 50 percent target by mid-week. The opposite path requires SPX to reclaim 7,420 with conviction, which would re-engage the bull bounce thesis and target SPX 7,450 to 7,475 as the mean-reversion zone. The probability weighting from the institutional positioning, the bond-yield path, and the geopolitical setup favors the downside.
Position sizing returns to one or two contracts maximum for the week. The 30-day VIX reading at 18.42 is roughly 50 percent above the seven-day average. No carry of any position through Wednesday's chip-sector earnings event. Friday's article tracked the Call Wall pin setup that resolved with the OPEX-week unwind; today's overnight breach is the post-expiration release that the institutional put hedges had positioned for. Our performance methodology documents the position-sizing rules that govern elevated-vol weeks.
The binary week ahead
The week's structural pivot is Wednesday. The FOMC Minutes release at 2:00 PM ET is followed by the chip-sector earnings event after the market close. The chip-sector implied move on the print is approximately 6 percent. The dispersion-trade unwind would amplify that into a 1.0 to 1.5 percent S&P 500 spillover, either direction. A strong beat with bullish forward guidance produces an estimated 1 to 1.5 percent SPX gap higher on Thursday's open. A miss or weak forward guidance produces an estimated 2 to 3 percent SPX drop on Thursday's open, which would test the dealer-positioning lower band at 7,295. The dollar auction at midday Wednesday is the secondary catalyst. The previous 30-year auction tailed above 5.00 percent. A 20-year tail at the same magnitude would amplify the yield path and re-engage the bond-equity correlation that has driven the past two sessions.
Monday's job is to position for the binary, not to predict it. The pin-and-grind approach that worked for the prior two weeks no longer applies. The compressed-volatility environment has been replaced with a directional environment that resolves on Wednesday afternoon.
The strikes that matter this week are not the moving averages or the daily pivots. They are the lines where positioning data and price action agree, and the line where they agreed at 1:00 AM Monday morning was the one that just broke.
AlgoIndex turns this same level work into automated entries, sizing, and exits across ES, NQ, GC, and CL.
View pricingFoundational guides
New to S&P 500 futures? Start with What Are ES Futures, the ES, NQ, MES & MNQ point value and contract specs, gamma exposure (GEX) explained, and market internals: TICK, ADD, VOLD and VIX.



