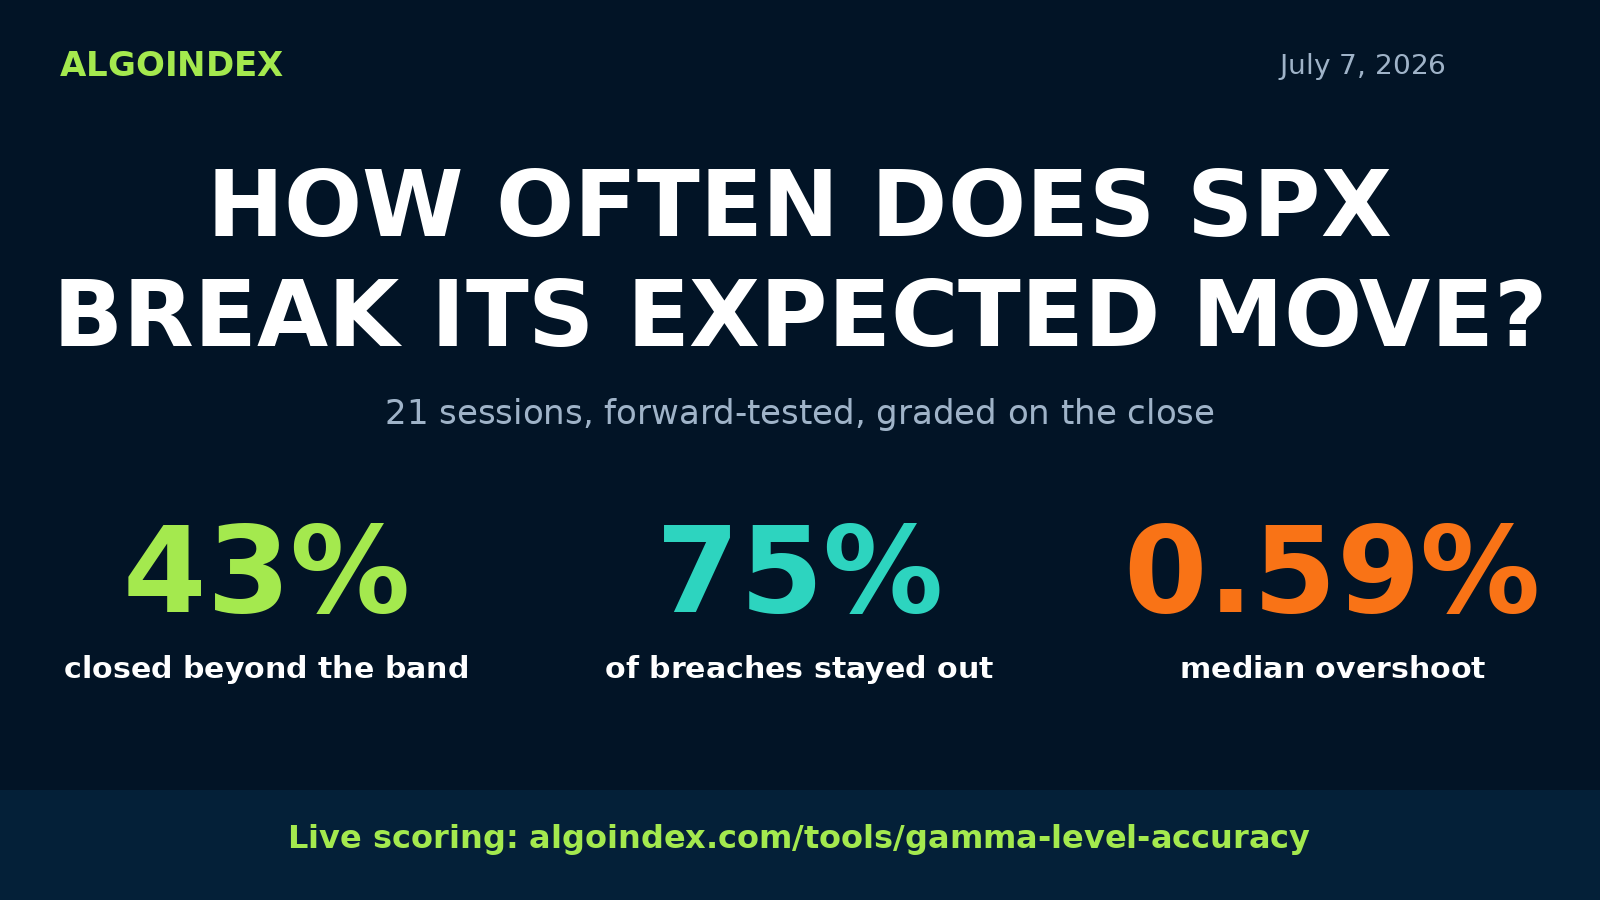
The short answer: across 21 scored sessions from June 3 to July 6, 2026, the S&P 500 closed beyond its morning options-implied expected move 9 times, a 43 percent break rate. Price traded outside the band intraday on 12 of 21 sessions, and once it broke through, it stayed out into the close 9 of 12 times. Sessions below the dealer gamma flip held the band more often, not less, because the options market priced those days about 40 percent wider.
On June 5 the morning option chain gave the S&P 500 a band 94 points wide, 7,537 on the low side to 7,631 on the high. The market ignored it. By the close the index sat at 7,385, more than 150 points below the bottom of the band, after printing a session low 169 points through it. That is a 2.2 percent overshoot of a level the options market had priced as the day's outer edge. Days like that are exactly why we stopped asserting things about the expected move and started counting.
The expected move is quoted everywhere and verified almost nowhere. Every morning it is recomputed, traded against, and forgotten by dinner. So we run it through the same scoring engine as the rest of our dealer-positioning levels: mark the band in the morning, grade it after the close, publish the running tally in the gamma level accuracy tracker, and never touch a grade after the fact. This study is the first month of that record, split by the one variable options traders argue about most: whether the index is trading above or below its dealer gamma flip.
How the numbers are produced
The method is fixed and published on the tracker page, so anyone can reproduce it. Each morning the engine pulls the S&P 500 option chain and computes a one-session band from at-the-money implied volatility: spot plus and minus spot times sigma times the square root of time. That is the same straddle-style arithmetic most desks use for a daily expected move. The band is stored before the session unfolds. After the close, the completed session's high, low, and close are compared against it: a day counts as a break when the index closes beyond either edge, and as held when it tests an edge and closes back inside. Days that never approach an edge are excluded from tested counts on wall levels; for the band itself, all 21 sessions in this window produced a grade. No level is ever re-marked after the fact. Forward-only, no lookahead.
The gamma environment tag comes from the same morning snapshot. When spot sat above the dealer gamma flip at capture, the day is tagged positive gamma; below it, negative gamma. June 2026 leaned bearish, so the sample splits 7 positive-gamma days against 14 negative-gamma days. Small numbers. We publish them anyway, with the counts attached, because the dataset grows every session and the live page always carries the current totals.
The finding that surprised us
The folk wisdom says negative gamma days are the dangerous ones: dealer hedging chases price instead of leaning against it, moves extend, bands break. Our sample says the opposite, and the reason is hiding in the width of the band itself.
On positive gamma days the band broke 4 times in 7 sessions, 57 percent. On negative gamma days it broke 5 times in 14, just 36 percent. The explanation is not that calm days turned wild and wild days turned calm. It is pricing. The median implied half-width on negative gamma days was 1.03 percent of spot against 0.73 percent on positive gamma days, roughly 40 percent more room. Implied volatility was already elevated on the below-the-flip days, so the option chain handed out wider allowances, and price, volatile as it was, mostly stayed inside them. The market charged enough for the chaos.
The break days that did the damage were often the quiet-looking ones. June 5, the worst overshoot of the window at 2.23 percent, started as a positive gamma morning with one of the narrower bands of the month. July 6 and June 30, both positive gamma days, broke through bands that priced daily moves under three quarters of a percent. A narrow allowance is easier to outrun than a wide one, whatever the environment label says.
What happens after a breach
Twelve sessions poked through an edge intraday. Nine of them closed out there. Only three times did the index breach the band and get pulled back inside by the bell, June 9, June 18, and July 2 in the log below. In this sample, a breach behaved like continuation three trades out of four. Breaks also split evenly by direction, 5 up and 4 down, so the band failed in both directions rather than only on selloffs. When a break stuck, the median session extreme reached 0.59 percent beyond the edge, with June 5 stretching to 2.23 percent.
For context, the sturdiest level in the same scoring engine is the dealer gamma flip itself: tested 36 times in the SPX record, held 29, an 81 percent hit rate. Prior-day high held 85 percent (11 of 13), the value-area high 87 percent (13 of 15), and the volume point of control 80 percent (12 of 15). The call wall held 57 percent (13 of 23) and the put wall 54 percent (14 of 26). The expected move band sits in the same middle tier as the walls: real, tradable, and a long way from a guarantee. All of these update daily on the live tracker, which now carries more than 220 scored SPX level outcomes.
How to trade with these numbers
Three practical reads fall out of the data. First, if a strategy sells premium at the band edges, its raw win rate in this window was the 57 percent hold rate, before costs, and the losers overshot by a median 0.59 percent. That is a thin edge that lives or dies on sizing. Second, a confirmed breach leaned toward continuation, 9 of 12 stayed out, which argues against reflexively fading the first move through the band. Third, the environment tag changes the width more than the odds: below the flip you are handed a wider band that holds more often, above it a tighter band that breaks more often. Position sizing that treats every expected move as the same trade is ignoring the most measurable difference between them. The mechanics behind the flip and the walls are covered in our dealer gamma positioning guide and the call and put walls explainer, and the same-day version of this problem lives in the 0DTE guide.
The complete session log
Every scored session in the window, exactly as graded. Band values are SPX index points from the morning capture.
| Date | Environment | Band low | Band high | Session low | Session high | Close | Result |
|---|---|---|---|---|---|---|---|
| Jun 3 | negative | 7,528.9 | 7,606.2 | 7,551.2 | 7,605.4 | 7,556.8 | held |
| Jun 4 | positive | 7,501.7 | 7,605.7 | 7,516.5 | 7,598.2 | 7,584.8 | held |
| Jun 5 | positive | 7,537.4 | 7,631.2 | 7,368.6 | 7,541.8 | 7,384.7 | broke down, 2.23% overshoot |
| Jun 8 | negative | 7,293.5 | 7,474.0 | 7,395.1 | 7,466.8 | 7,405.8 | held |
| Jun 9 | negative | 7,340.1 | 7,471.3 | 7,237.9 | 7,483.2 | 7,386.3 | held after breaching both edges |
| Jun 10 | negative | 7,309.4 | 7,463.9 | 7,265.9 | 7,396.6 | 7,267.7 | broke down |
| Jun 11 | negative | 7,170.4 | 7,363.6 | 7,257.3 | 7,412.7 | 7,393.1 | broke up |
| Jun 12 | negative | 7,310.1 | 7,478.5 | 7,363.0 | 7,456.4 | 7,430.9 | held |
| Jun 15 | negative | 7,361.7 | 7,501.2 | 7,516.8 | 7,577.9 | 7,555.3 | broke up, gapped through |
| Jun 16 | positive | 7,499.2 | 7,609.4 | 7,508.7 | 7,565.0 | 7,513.0 | held |
| Jun 17 | positive | 7,445.1 | 7,577.7 | 7,402.6 | 7,532.2 | 7,421.8 | broke down |
| Jun 18 | negative | 7,332.9 | 7,507.3 | 7,468.3 | 7,511.1 | 7,497.9 | held, brief poke above |
| Jun 22 | negative | 7,441.4 | 7,559.7 | 7,460.0 | 7,530.0 | 7,475.5 | held |
| Jun 23 | negative | 7,419.1 | 7,526.5 | 7,347.6 | 7,424.2 | 7,365.9 | broke down |
| Jun 24 | negative | 7,290.4 | 7,440.5 | 7,336.8 | 7,428.1 | 7,359.9 | held |
| Jun 25 | negative | 7,276.0 | 7,440.5 | 7,323.5 | 7,419.1 | 7,357.2 | held |
| Jun 26 | negative | 7,281.1 | 7,433.9 | 7,294.2 | 7,393.0 | 7,337.8 | held |
| Jun 29 | negative | 7,279.7 | 7,428.3 | 7,348.9 | 7,444.3 | 7,439.3 | broke up |
| Jun 30 | positive | 7,386.3 | 7,494.6 | 7,438.0 | 7,508.3 | 7,496.3 | broke up |
| Jul 2 | positive | 7,427.9 | 7,538.6 | 7,427.6 | 7,540.8 | 7,477.6 | held, poked both edges |
| Jul 6 | positive | 7,433.4 | 7,533.1 | 7,501.0 | 7,551.3 | 7,538.3 | broke up |
Environment is tagged at the morning capture: positive when spot sat above the dealer gamma flip, negative when below. Result is graded on the close. The tracker's first fully scored session is Jun 3, 2026; July 7 is in progress and not yet graded.
Honest limits of this study
Twenty-one sessions is one month of market. Seven positive-gamma days cannot pin down a rate to better than a very wide range, and June 2026 was an unusually bearish stretch, which is why negative-gamma days outnumber positive two to one. The direction of the environment split could flip as data accumulates. What will not change is the method: every band is stamped before the session and graded after it, the scoring rules are published, and the tracker page always shows the current totals with their tested counts attached. We would rather publish small honest numbers than large invented ones. This page will be refreshed as the record grows.
Use this chart
Writers and analysts are welcome to embed the summary chart with attribution. Copy the snippet below; the image stays hosted by us and the numbers on this page are the citable source.
<a href="https://algoindex.com/research/expected-move-break-rate-spx-gamma-study">
<img src="https://algoindex.com/marketing/blog/expected-move-break-rate-2026-07.svg"
alt="S&P 500 expected move break rate by gamma environment, forward-tested by AlgoIndex"
width="800" />
</a>
<p>Source: <a href="https://algoindex.com/research/expected-move-break-rate-spx-gamma-study">AlgoIndex expected move break-rate study</a></p>
Frequently Asked Questions
The expected move is the one-session price range implied by option prices, computed from at-the-money implied volatility as spot plus and minus spot times sigma times the square root of time. It is the options market's estimate of how far the index is likely to travel by the end of the session.
How often does the S&P 500 stay inside its expected move?In our forward-tested sample of 21 sessions from June 3 to July 6, 2026, the index closed inside its morning expected move band 57 percent of the time and closed beyond it 43 percent of the time. Intraday, price traded outside the band on 57 percent of sessions. The live totals update daily on our accuracy tracker.
Does negative gamma make the expected move break more often?Not in this sample. Sessions below the dealer gamma flip broke their band 36 percent of the time versus 57 percent for sessions above it. The reason is pricing: implied volatility was higher on negative gamma days, so the band was about 40 percent wider and contained more of the movement. The sample is small and the split may change as data accumulates.
Should you fade a move through the expected move band?The data leans against automatic fading. Of the 12 sessions that breached the band intraday, 9 closed outside it. A breach behaved like continuation three times out of four in this window. Any fade needs additional evidence, and only risk capital belongs in trades like these.
Where does the data come from?Every number on this page comes from the AlgoIndex gamma level accuracy tracker, which marks the levels each morning from the live option chain and grades them after the close under a fixed, published methodology. Nothing is back-fitted and no grade is revised after the fact.
Watch the record grow, level by level.
The gamma level accuracy tracker scores the expected move, the gamma flip, and the walls every session, free. Methodology lives in the performance statement, and if you want the levels marked for you each morning, view pricing.
Related: the complete gamma exposure guide, call and put walls, and dealer gamma positioning. See also whether price actually pins to max pain.