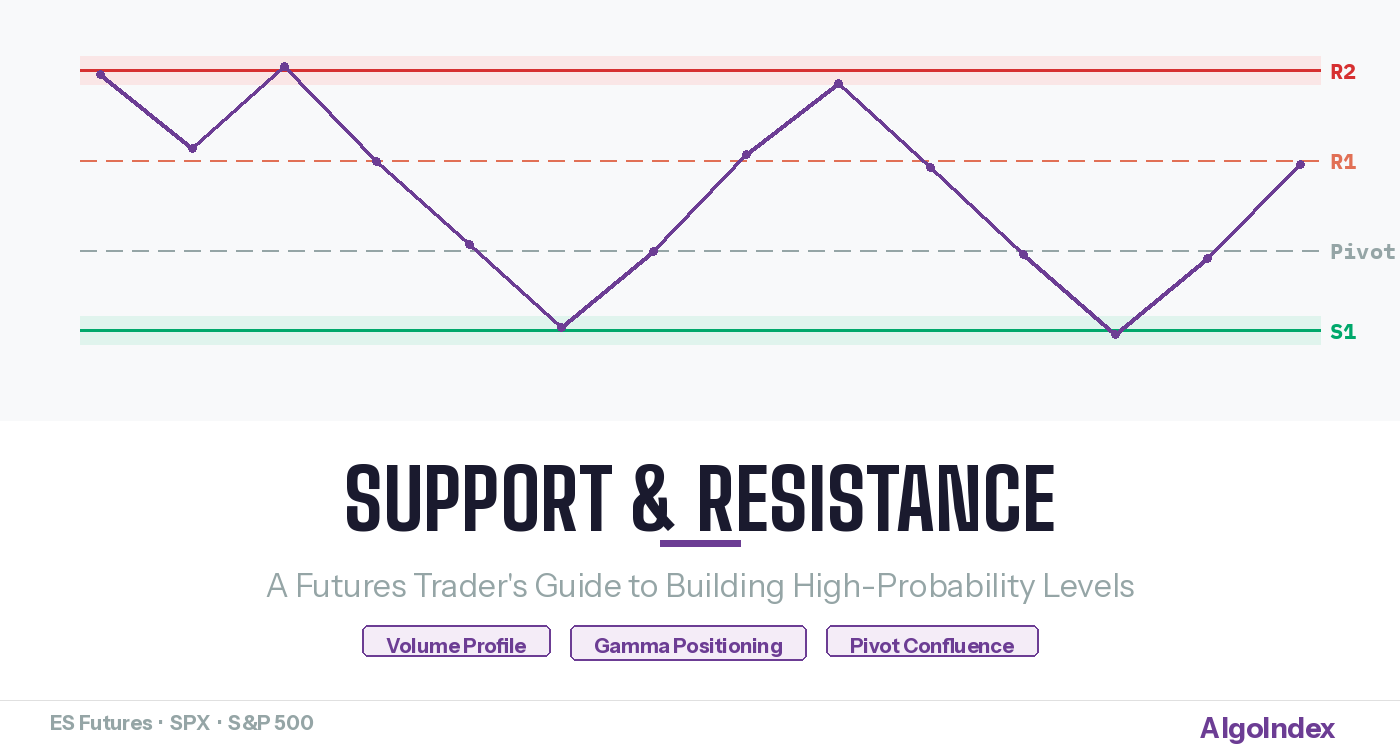
Volume Profile
POC & Value Areas
Where institutional capital agreed on value
Gamma Positioning
Dealer Hedging Walls
Mechanical support & resistance from options flow
Confluence Zones
2-3 Method Stacks
Where multiple independent sources align
At 2:13 PM on a Tuesday in February, ES futures dropped nine points in four minutes, stalled at 6,042, and reversed. By the close it had recovered every tick and then some. That number, 6,042, was not random. It was the previous week’s point of control, the strike with the heaviest dealer gamma concentration, and the exact level where the 50-day moving average happened to sit. Three unrelated methodologies pointed to the same price, and price respected it to the tick.
That is what functional support and resistance looks like in practice. Not a line someone drew on a chart because it “looked important,” but a level where multiple sources of structural evidence converge. For futures traders working the S&P 500, the difference between a level that holds and one that slices through is almost always a question of how many independent confirmations stack behind it.
Why Most Support and Resistance Fails
The standard approach, connecting swing highs and drawing horizontal lines, produces too many levels and too little conviction. A daily chart of ES futures can show dozens of prior swing points within a 200-point range. Trading every one of them is a recipe for overtrading and confusion.
The problem is not the concept. Price does react at prior extremes, value areas, and structural pivots. The problem is that most traders stop at a single method and treat every line as equal. A swing high from three weeks ago, tested once and never revisited, carries almost no weight compared to a level tested four times across multiple sessions with visible absorption in the order book each time. Institutional desks do not draw lines on charts. They watch where liquidity pools form, where options dealers are forced to hedge, and where the volume profile shows genuine acceptance. A resistance level only matters if someone with meaningful capital cares about defending it.
Building Levels That Actually Hold
Durable SPX support and resistance levels tend to come from four distinct sources, and the strongest zones sit where two or more of these overlap.
The first source is the volume profile. The point of control from a prior session or from a multi-day composite marks where the most volume transacted, meaning institutional participants agreed on value at that price. Value area highs and lows (the range containing 70% of volume) create natural boundaries. When price returns to a prior value area high from below, it often acts as resistance because the market already decided that prices above that level were not accepted value.
The second source is session-based reference points: the previous day’s high and low, the overnight high and low, and the settlement price. These are levels that every futures trader on every desk sees. Their universality is what gives them power. When ES tags the prior day’s high and stalls, it is not magic. It is thousands of participants using the same reference point to manage risk.
The third source, and one most retail traders miss entirely, is options-derived levels. Dealer gamma positioning creates mechanical support and resistance because market makers are forced to hedge their options exposure. When there is heavy positive gamma concentrated at a specific strike, dealers buy dips and sell rallies around that price, effectively dampening moves and creating a magnet. The strike with the largest gamma concentration often acts as the session’s gravitational center. Conversely, when price drops below the level where gamma flips from positive to negative, moves accelerate because dealer hedging switches from stabilizing to amplifying. Understanding where these mechanical boundaries sit gives you information that pure price action analysis cannot provide. For a deeper explanation of this mechanic, our guide to reading gamma exposure breaks down how dealers create these invisible walls.
The fourth source is computed pivot levels derived from the prior session’s open, high, low, and close. Standard pivot calculations (R1, R2, R3, S1, S2, S3) are widely used by institutional desks as initial reference points. They are not predictions, they are organizational tools. When a computed pivot level coincides with a volume profile node and a heavy gamma strike, that confluence transforms a statistical calculation into a real barrier.
Confluence Is the Filter
A single-method level is a suggestion. A two-method confluence zone is worth watching. A three-method stack is where you build a trade plan around.
Here is how this works in practice. Suppose the prior day’s high sits at 5,980. The volume profile shows a low-volume node just above at 5,983, meaning price moved through that area quickly and never built acceptance. Options flow data shows a call wall, the strike with the highest positive gamma from call options, at the 5,980 strike. Computed pivot R1 lands at 5,978. You now have four independent reasons to expect selling pressure in the 5,978 to 5,983 range. That is a resistance zone with structural depth, not just a line.
The same logic applies to support. If the overnight low at 5,920 coincides with the point of control from a two-day composite profile and sits directly on the level where gamma exposure flips from positive to negative, that is a level where institutional hedging flow, volume acceptance, and session structure all converge. It deserves your attention. This approach to identifying pivots through options flow analysis adds a dimension that pure technical analysis cannot replicate.
Validating Levels in Real Time
Identifying a level before the session opens is only half the work. The other half is watching how price behaves when it arrives there. A level’s quality reveals itself through market microstructure: does price slow down, does volume spike, do large resting orders appear in the book, does the real-time hedging flow flatten or reverse?
The strongest confirmations come when multiple signals align at the moment of the test. Price reaches your pre-identified zone, breadth indicators (advancing versus declining issues, up volume versus down volume) shift direction, and cumulative options delta flattens or diverges from price. That trifecta, structural level plus breadth confirmation plus flow exhaustion, is what separates a high-probability reaction from a coin flip. We covered this multi-signal approach in our complete guide to ES futures trading, which walks through how professional desks combine these data streams.
Levels that fail on the first test often become acceleration points. If ES breaks through a zone where three methods converged and sellers could not hold it, the breakout tends to carry further than usual because every trapped short becomes fuel for the move. Failed support becomes resistance, and failed resistance becomes support, but only if the original level had genuine structural weight. A level that was marginal to begin with does not invert into anything meaningful.
The traders who consistently extract value from support and resistance are not the ones with the most lines on their chart. They are the ones who can explain exactly why a specific price matters, from at least two independent angles, before the session begins.
Past results are not indicative of future performance. This content is for informational and educational purposes only and does not constitute financial advice or a recommendation to buy or sell any security or futures contract. For our full performance disclosure, visit algoindex.com/performance-statement.
AlgoIndex Research · algoindex.com · Start your free trial
Frequently Asked Questions
Key support and resistance levels in ES futures come from multiple sources: prior session highs and lows (PDH/PDL), overnight highs and lows (ONH/ONL), volume profile levels (POC, VAH, VAL), pivot point calculations, moving averages (especially the 50-DMA and 200-DMA), and price levels where significant buying or selling previously occurred. The strongest levels have confluence from multiple methods pointing to the same price area.
Static support and resistance levels are fixed price points like prior day highs, pivot points, and round numbers that do not change during the session. Dynamic levels move with price action and include indicators like VWAP (Volume Weighted Average Price), moving averages, and trend lines. Professional traders use both: static levels for targets and entries, and dynamic levels for trend direction and intraday bias.
Volume, order flow, and options positioning provide clues. A level is more likely to hold when: volume decreases as price approaches it, options dealers have significant gamma exposure at that strike (creating natural buying or selling pressure), and breadth indicators confirm the move is losing momentum. A level is more likely to break when: volume increases into the level, dealer gamma is negative (amplifying the move), and market internals like TICK and ADD confirm broad participation in the direction of the break.
Join the Discussion
Connect with other ES futures and SPY options traders. Share setups, discuss levels, and get real-time market insights from our community.
Join AlgoIndex Trading CommunityRelated guides
- What Is Gamma Exposure (GEX)?. How dealer gamma sets the call wall, put wall and gamma flip on ES futures.
- Market Internals: TICK, ADD, VOLD & VIX. Read breadth and the advance/decline line intraday.
- ES, NQ, MES & MNQ Contract Specs & Point Value. Point value, tick value and margin for every contract.
- Trading SPY Signals: S&P 500 Strategies. A complete framework for SPY signals.
- Value Area and VPOC. Volume-profile support and resistance, with forward-tested hold rates.