
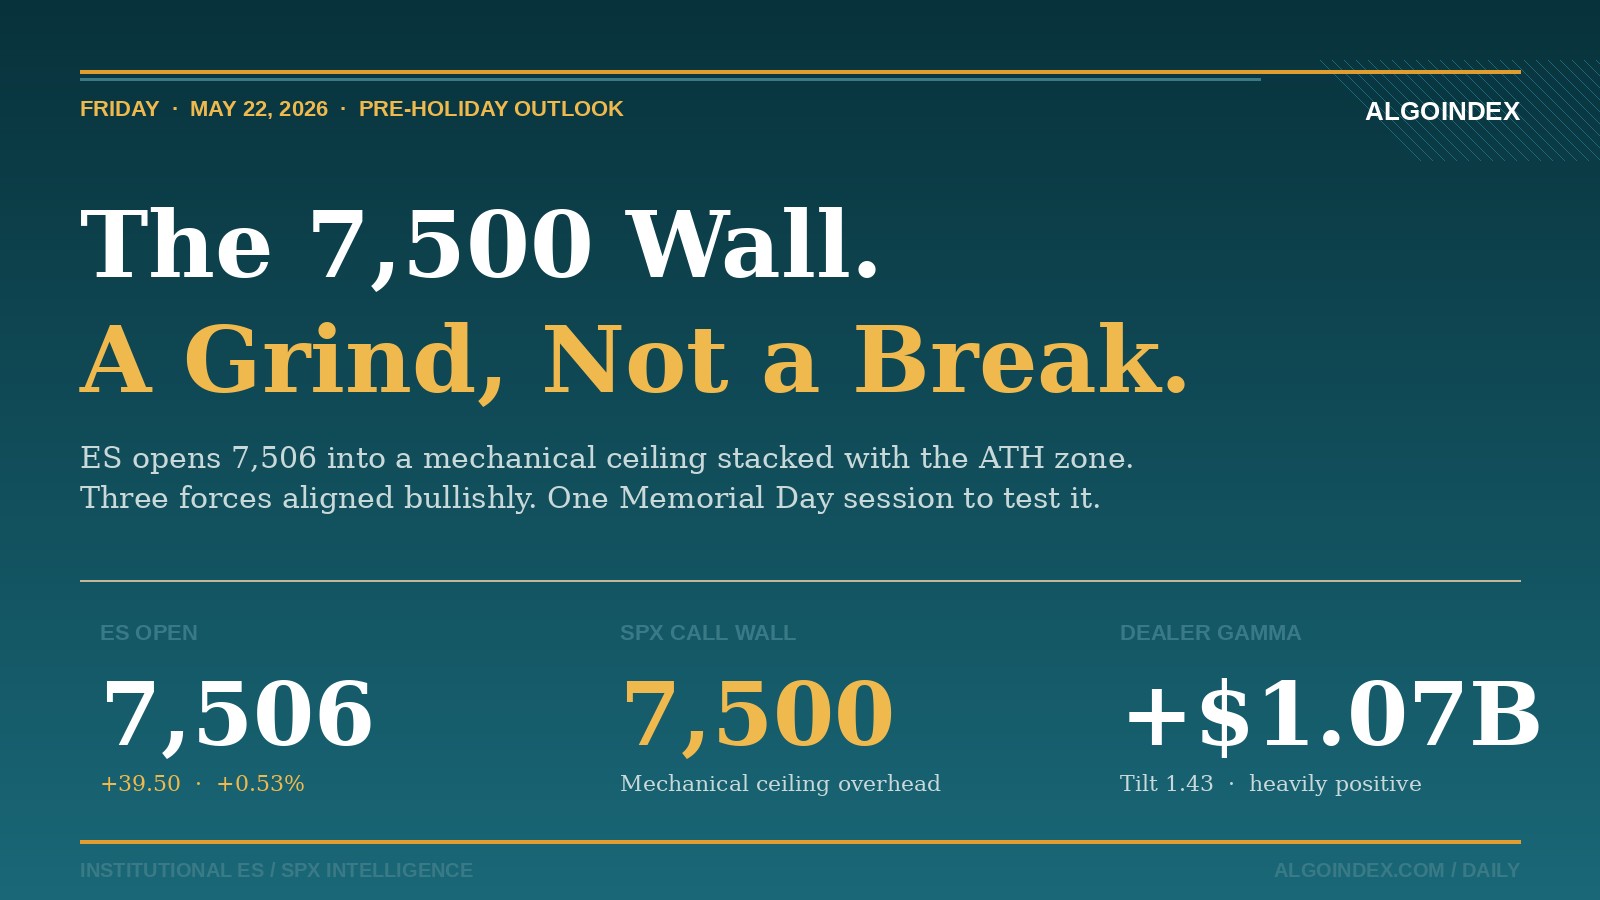
By 9:36 ET on Friday, ES had already done the work most sessions take all day to do. The contract opened at 7,506.25, up 39.50 points from Thursday's close, with the overnight session having drifted from 7,464 to a 7,512 high in a single uninterrupted lift. The session POC was forming at 7,503.75. The cumulative volume delta read +3,053 since the open. The largest visible offer in the order book sat at 7,510, holding 164 contracts. And one block higher, at SPX 7,500 cash, sat the structural ceiling that would define the next six trading hours: the Call Wall, a mechanical resistance level where the largest concentration of dealer call positioning lives. Above it, dealer hedging flips from passive to active selling. Below it, the same hedging anchors price to the strike.
This is the setup heading into the longest weekly winning streak the index has produced since 2023, with three forces aligned bullishly and one ceiling holding them in place. The path of least resistance over the next six hours is a grind into the wall, not through it. Memorial Day weekend, which closes US markets on Monday May 26, applies the final compression: traditional pre-holiday vol-selling adds bullish edge, but Iran tail risk caps how aggressively that vol-selling can extend. The result is a session that wants to be quiet. It usually gets what it wants when positive dealer gamma is this large.
The Three Forces, All Pointing the Same Direction
The macro picture is risk-on with unusual clarity. Iran de-escalation momentum continues to build: Pakistan's army chief is en route to Tehran, Qatar's negotiating team is coordinating with the US, and Iran has appointed Ghalibaf to lead its negotiation delegation. Secretary of State Rubio confirmed Pakistan is the "primary interlocutor" in Iran talks. The Wall Street Journal's Norman caveated that "draft deals circulating are inaccurate," so the optimism is fragile, not settled. But fragile optimism still moves crude oil down 1.2 percent to $99.58, weakens the dollar against the index basket, and lifts US indices. That is a clean risk-on signature.
Positioning confirms the macro read. Real-time hedging flow shows extreme positive gamma in IWM ($306.9 million, 100th percentile) and EWZ ($17.7 million, 100th percentile). NVDA carries bullish delta of +$1.29 billion. The largest premium options trades of the morning are all calls, all long-dated, all bullish: NVDA 140 calls expiring January 2027 traded for $3.5 million, AMD 290 calls expiring December 2028 for $2.8 million, FSLR 220 calls for $3.4 million. When the largest premium hits of the session are uniformly bullish and uniformly long-dated, the institutional read is not hedging, it is conviction.
Order flow ratifies the rest. Cumulative delta is +3,053 since the open. The market-on-open imbalance was +$262 million BUY on the SPX side. Order-flow data shows acceptance above yesterday's high, which is the cleanest possible read of an overnight breakout. None of the three forces is leaning the other way.
The Wall That Defines the Day
The SPX 7,500 Call Wall is the most consequential level on the chart, and not because of its proximity to current price. It is consequential because of what is happening above it. Just 17 points up, at SPX 7,517, sits the 1-month, 13-week, and 52-week high simultaneously. The Call Wall and the all-time high zone are stacked within a 17-point shelf, which means any move through the wall walks immediately into structural resistance with no intermediate support to defend the rally. Positive dealer gamma sits at +$1.067 billion, the gamma tilt reads 1.427 heavily positive, and the implied 1-day move is 0.65 percent. Those three numbers describe a market where dealers are mechanically forced to sell strength and buy weakness, dampening every directional impulse. With a wall ceiling and a dampening mechanism, the highest-probability outcome is range-bound chop around the 7,500-7,520 ES zone.
The combo magnets reinforce this. The closest probability concentration sits at SPX 7,498 (99.89 percent confidence), 7,505 (84.24 percent), and 7,513 (91.61 percent), with another high-probability magnet at 7,520 (95.21 percent). These are statistical concentrations where options-driven price pressure most often resolves. The clear interpretation: price wants to oscillate in the 7,498-to-7,520 SPX corridor through Friday's close, which translates to roughly 7,517-to-7,539 in ES futures terms.
Where the Trend Indicators Stand
The medium-term trend signature is the strongest of the past month. The 9-day directional index reads 30.60, with positive directional pressure at 33.57 against negative directional pressure at 19.82. That is a confirmed strong uptrend by any standard interpretation. The 14-day relative strength index sits at 66.81, rising but not overbought. The 14-day average true range computes to 76.19 points, or 1.02 percent of SPX cash, which sets the expected daily envelope at roughly 7,470 to 7,535 on ES. The 5-day moving average sits 37 points below current price. The 20-day moving average sits 125 points below. The 50-day moving average sits 475 points below. Price is meaningfully extended above every short and intermediate trend reference, but the trend strength reading still shows acceleration, not exhaustion.
The composite indicator read is a 100 percent BUY across all 13 short, medium, and long-term technical inputs. A month ago that same composite read 40 percent BUY. The shift from 40 to 100 is the largest one-month directional change in the indicator since the early-April reversal. This is the kind of breadth confirmation that, when combined with extreme positive gamma, usually produces additional days of grind rather than immediate reversal.
The Catalysts Inside Friday and Beyond It
Three events sit inside Friday's session and one carries the most weight. At 10:00 ET, the University of Michigan's final May sentiment reading prints (consensus 48.2), alongside the final 1-year inflation expectation (consensus 4.6 percent). These are revised numbers from preliminary readings already released, so the market impact is typically muted unless one of the components surprises significantly. At the same hour, Federal Reserve Governor Christopher Waller speaks. Waller has voted dovishly in the recent cycle, which makes any policy guidance market-moving. At 15:00 ET, President Trump delivers remarks. Headline risk on Iran and trade policy is the unpredictable element of any Trump speech.
What sits beyond Friday matters more. Memorial Day closes US markets on Monday May 26. The shortened week ahead carries the macroeconomic payload of the next two weeks. Consumer Confidence prints Tuesday. Durable Goods, GDP second estimate, and the Federal Reserve's quarterly bank stress test results print Thursday. And on Wednesday morning at 8:30 ET, core PCE inflation prints for April, with consensus expecting 3.3 percent year-over-year and 0.3 percent month-over-month. PCE is the Federal Reserve's preferred inflation gauge and the single most consequential print between now and the June FOMC meeting. The market that grinds into a Call Wall on Friday afternoon will reopen Tuesday morning into a calendar that resolves the next leg.
The Primary Setup
A long entry on a pullback into the 7,494 to 7,500 ES zone, with a stop at 7,481 (below yesterday's close acceptance band), a first target at 7,519 (the SPX 7,500 Call Wall ceiling), and a second target at 7,535 (the SPX 7,517 ATH equivalent). Conviction is moderate. Three-force bullish alignment supports the long, but the Call Wall caps near-term upside with mechanical certainty. The pre-holiday compression typically resolves with light-volume drift, not directional expansion. Performance methodology details the historical execution of this kind of with-trend continuation setup. The Standing session rules apply: no entries before 9:45 ET, no positions through the 4:00 ET close, and disciplined sizing on any add. The largest risk is not that the wall holds. The largest risk is that one Iran headline rewrites the macro frame before the wall gets tested.
The grind into the lid is the most familiar pattern in markets, and almost never the one that catches anyone off guard.
For context on how a similar binary-day structure resolved earlier this week, read ES Futures Binary Wednesday: Fed Minutes and Nvidia Earnings. For the dealer-positioning framework that drives Call Wall mechanics, see the performance methodology.
See how AlgoIndex translates this kind of three-force, gamma-anchored read into systematic signals every trading session.
View pricing →Foundational guides
New to S&P 500 futures? Start with What Are ES Futures, the ES, NQ, MES & MNQ point value and contract specs, gamma exposure (GEX) explained, and market internals: TICK, ADD, VOLD and VIX.



