
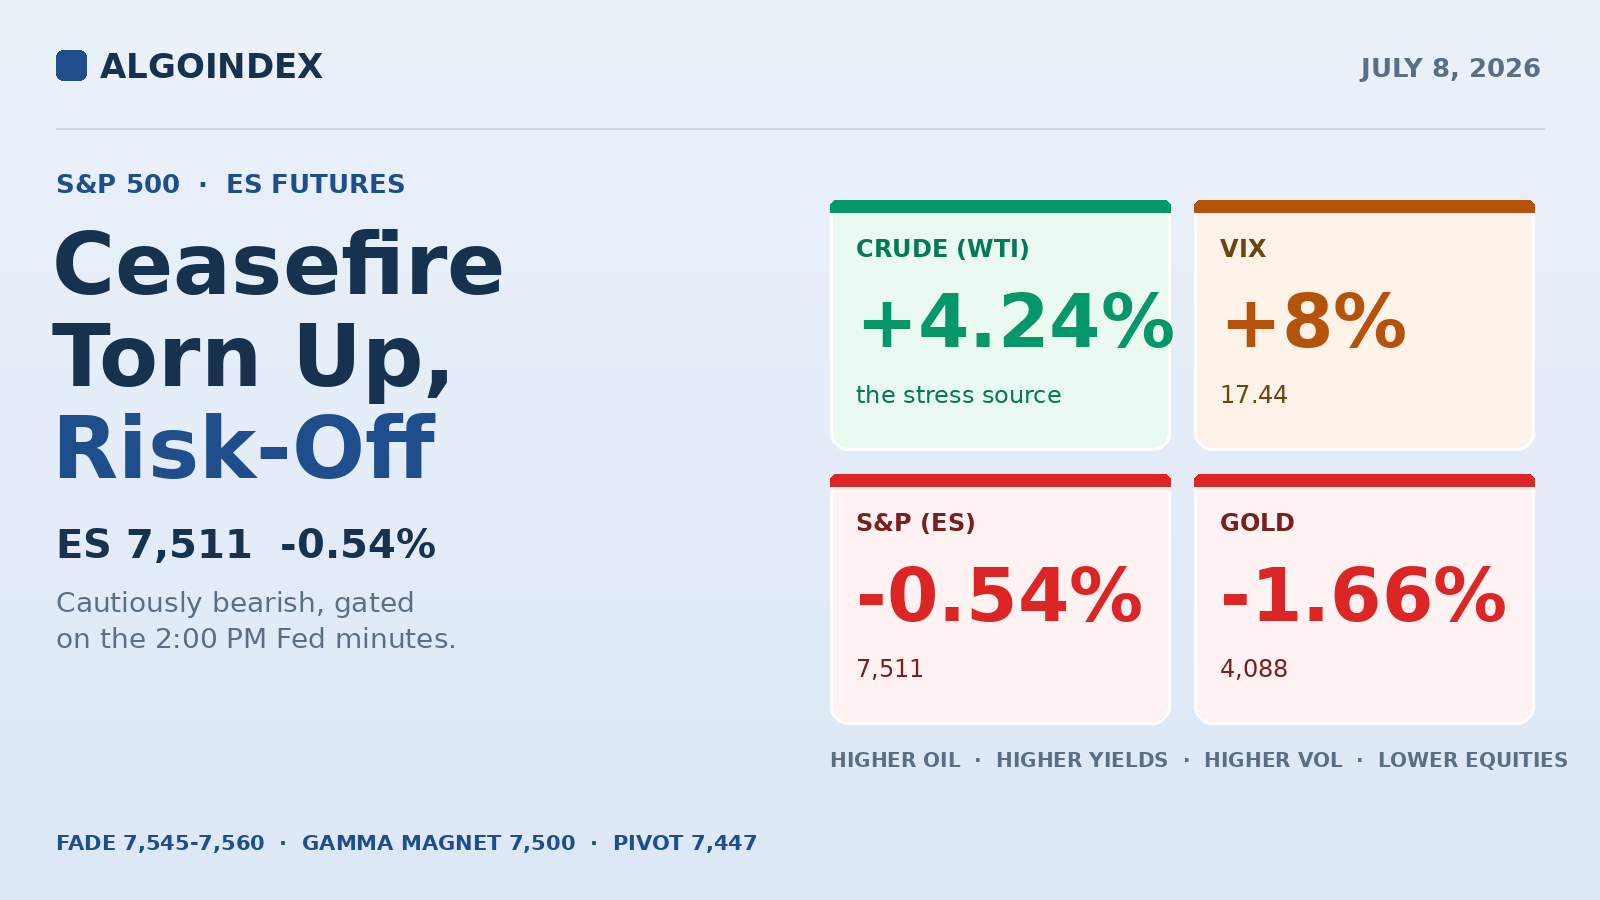
ES opens Wednesday near 7,511, down 0.54 percent, after the administration declared the US-Iran ceasefire over overnight. Crude jumped more than 4 percent, the volatility index spiked 8 percent to the mid-17s, yields pushed higher, and equities sold off. The trend is lower short-term, but dealer positioning is still stabilizing, buying dips and selling rallies all the way down to about 7,250. The plan: fade a clear rejection of the 7,507 to 7,531 band toward 7,470 and then 7,447 as a stretch, treat it as a range-fade because dips are being bought above 7,257, and stand aside into the 2:00 PM Fed minutes. Bias cautiously bearish, conviction moderate, event-gated.
At some point overnight a single headline rewrote the session: the administration declared the US-Iran ceasefire over. Crude ran more than 4 percent, Treasury yields pushed up, the volatility index jumped 8 percent to the mid-17s, and ES gapped down from a 7,545 Globex open to a 7,468.50 low before clawing back roughly half of it to sit near 7,511. The overnight range spanned 94.5 points, right on the 14-day average, so this was a real move on a real catalyst, not a thin-liquidity air pocket.
It landed on a market already leaning. Semiconductors had shed roughly 4 percent into Tuesday's close, the Nasdaq is underperforming again, and the 4-hour chart printed a change-of-character to the downside after topping near 7,600 on July 7. We flagged the 7,604 call wall as the ceiling in yesterday's note; the rally stalled at 7,602 and this is the roll-over from it. The counterweight is dealer positioning: 7,500 is now the single major strike on the board, and the desk read is mean-reversion, dips bought and rallies sold, intact all the way down to about 7,250 before anything turns disorderly. Lower, but not falling apart.
A momentum inflection, not a reversal
Tuesday's regular session was rattled by a semiconductor selloff and a crude jump that pushed yields higher. The cash S&P traded a roughly 75-basis-point range and closed 7,504 while the Nasdaq fell about 2 percent, and the volatility index finished near 16.1, up 3.7 percent on the day. Overnight the geopolitical headline accelerated the tone: ES ground from the 7,545 open to 7,468.50 and retraced half to 7,511, on healthy volume near 288,000 contracts and open interest near 1.95 million. This is a positioning-driven move, not a low-participation drift.
The longer-term structure is not in question. The contract sits well above its 50-day (7,490.25), 100-day (7,187.81), and 200-day (7,084.67), and it is up more than 15 percent over 52 weeks. The 52-week high of 7,693.75 was set June 2, and the most recent swing high near 7,602 printed July 6 before the reversal now in progress. The five-day performance is down 1.28 percent, the first meaningful weekly dip after a persistent grind, with the one-month low at 7,292.25 and the one-month high at 7,648.75 framing the range and price sitting in the lower-middle third. The 4-hour chart tells the cleanest story: a rally from a June 26 swing low near 7,350 to a higher high near 7,600 on July 7 confirmed a break of structure up, then failed, cutting through prior swing supports to the 7,469 low with a sharp change-of-character. That is a momentum inflection, not yet a confirmed trend reversal, but the burden of proof has shifted to the bulls, and the oscillator matrix has rolled over from its peak.
The moving-average stack captures the split. Against spot near 7,511, the 5-day at 7,543.90 is above price (near-term weak), the 20-day at 7,501.31 marginally below (the pivot to hold), the 50-day at 7,490.25 below, and the 100-day and 200-day far below. The 7,490 to 7,501 band, where the 20-day and 50-day converge, is the structural hinge; sustained trade below it tips the near-term balance bearish. Momentum is neutral and losing its lean, the 14-day relative strength right at the midline near 50.2 with the 9-day at 48.4, stochastics elevated but hooking lower (9-day fast near 78, signal near 80, 14-day near 69), and the directional index at 19.1 below the trend threshold with the down-line (21.4) above the up-line (14.3). The composite reads 48 percent buy, essentially balanced with a faint bearish lean, and historic volatility near 12 percent stays moderate.
Positioning defends the dip, up to a line
The index options surface is the primary flow read, not a proxy. The morning dealer map marks cash resistance at 7,500, 7,520, 7,550, and 7,600, a pivot at 7,440 (supportive above, fragile below), and support at 7,450, 7,400, 7,380, and 7,300. The critical nuance: 7,500 has flipped to the top of the resistance stack and is now described as the single major strike and the intraday upside resistance, the same zone that acted as support in Tuesday's read. Positive dealer positioning still dominates, which mechanically produces mean-reversion, dips bought and rallies sold, and that stabilizing condition is expected to hold all the way down to roughly 7,250 cash before positioning flips negative and moves accelerate. The desk's explicit stance is to buy relative dips as a trade while positive positioning holds, even as it acknowledges the trend is clearly lower.
"The decline has not turned disorderly because relative lows keep showing mean-reversion. Below roughly 7,250 in the cash index, that changes."
The caution sits underneath the surface. One-month implied correlation is at two-year lows near 4.6, a condition that leaves the index vulnerable to sudden, correlated downside, which is exactly why desks have been layering inexpensive short-dated protection. Put volume near 948,000 runs well ahead of call volume near 534,000, the put-to-call open-interest ratio near 1.28 confirms the hedging tilt, and the skew rank near 65 percent shows elevated demand for downside strikes, even as the implied-volatility rank near 18 percent keeps that protection cheap in absolute terms. Net call positioning stays positive near 5.7 billion, which argues for the pinning near 7,500. Tuesday's real-time hedging flow climbed to roughly plus 8 billion before fading to plus 2 billion into the close, driven mainly by same-day call buying, the dip-buying reflex in action. The tail the desk flags: price correlations, volatility correlations, and an oil-and-rates macro flare are all stretched at once, the ingredients for an August-2024-style volatility spike, and a resync could push the volatility index toward the high-20s or 30 if the dispersion unwinds.
Risk-off, with an energy bid
Higher oil, higher yields, higher volatility, lower equities: the standard energy-supply risk-off, with Nasdaq -0.69% and Dow e-mini -0.82%.
Geopolitics is the proximate catalyst. The ceasefire declaration reintroduced Middle East supply risk, with reports of Iranian airport closures in the Hormozgan region and diplomatic activity across the Gulf, and the reaction, higher oil, higher yields, higher volatility, lower equities, is the standard risk-off response to energy-supply uncertainty. Headline risk is elevated and two-directional; any de-escalation language could reverse a chunk of the overnight move as fast as it appeared. Leadership is the soft spot. The chip complex sold off roughly 4 percent into Tuesday's close and keeps weighing, the Nasdaq-100 e-mini down about 0.69 percent and the tech-heavy ETF proxy closer to 1.85 percent pre-market; the damage runs deeper than one session, with the chip ETF proxy down roughly 15 percent and the memory complex closer to 25 percent over the past ten sessions. That single-stock weakness is occurring into positive single-stock positioning, which throttles how fast the broad index can fall.
The dollar index is essentially flat near 101.14, a muted currency response that says this is more a risk-and-energy story than a pure rates story, even with yields higher on the crude spike. Rate sensitivity is front and center: Fed meeting minutes are due at 2:00 PM ET and a Fed Chair testimony is on the docket, either of which can reprice the front end and equity multiples in seconds, while a 10-year note auction and a 30-year bond auction add supply-side pressure. Breadth is negative but with a rotation signature, energy the standout winner on the crude jump, technology and semiconductors the clear laggards, defensives and the dollar quiet. Risk-off with an energy bid tends to produce choppy, rotational trade rather than a one-way slide.
The trade: a range-fade, not a trend-down
Dealer positioning marks 7,507 as the session ceiling in a rallies-sold environment, so favor fading strength on a clear rejection of the 7,507 to 7,531 band rather than waiting for the higher 7,545 to 7,560 shelf, which may not print. Targets are 7,470 first, then 7,447 as a stretch, and bank profit into those levels because dips are being bought above 7,257 and a clean slide is unlikely without a fresh catalyst. Structural stop above 7,572. Invalidation on a sustained 15-minute close above 7,572; a clean reclaim of 7,583 flips the near-term bias higher. Treat this as a range-fade, not a trend-down trade, because real downside acceleration only opens below 7,257. Stand aside into the 2:00 PM ET minutes and let structure re-form before acting.
The conditional long is the lower-probability bullish path, and it needs a clean trigger: only on an open that reclaims and holds 7,560 with chips stabilizing, targeting 7,583 then 7,600, stop below 7,531, sized down given the headline environment. Skip everything before 9:45 ET, skip if price chops directionlessly between 7,505 and 7,540 with no clean rejection or acceptance, skip fresh entries inside the 2:00 PM window, and skip while a fresh de-escalation or escalation headline is actively moving price. Wait for structure to settle.
Today's economic calendar (ET). The 2:00 PM minutes are the single first-order event.
A volatile, rotational session that respects the 7,470 to 7,560 envelope until the minutes force a resolution.
The trend is lower and the catalyst is real, but the dip-buying reflex is intact down to 7,250. Discipline over conviction until the minutes pick a side.
The complete data picture
Every level and reading from the morning ES review, top to bottom. Levels are in E-mini terms, cash-index equivalent about 7 points lower. Nothing rounded away.
| Resistance (top to bottom) | Support (top to bottom) |
|---|---|
| 7,693.75 52-week high | 7,500 to 7,507 cash-7,500 major strike, 2-SD support 7,506, prior demand (contested pivot) |
| 7,648.75 one-month high | 7,468 to 7,489 second pivot support 7,488.92, 50% retrace 7,470.50, overnight low 7,468.50 |
| 7,632 second-level pivot resistance | 7,440 to 7,448 third pivot support 7,448, dealer pivot near 7,447 (cash 7,440, supportive above / fragile below) |
| 7,580 to 7,607 first-SD resistance 7,583, failed swing high / prior-week high near 7,600, options wall | 7,407 support |
| 7,545 to 7,563 session open 7,545, daily pivot 7,560.67, overnight high 7,563 | 7,375 four-hour volume node |
| 7,520 to 7,531 40-day MA 7,531, prior-support-turned-resistance, flipped 1-SD support | 7,290 to 7,300 heaviest long-term volume node, one-month low 7,292.25 |
A real catalyst, a rolling chart, and a dealer bid that will not quit above 7,250.
See how AlgoIndex turns this kind of read into systematic signals. Read yesterday's S&P rotation note and the pillar on how dealer call and put walls behave.
View pricingUpdate: July 9: ES is pinned by positive gamma, with a Hormuz tail.



