Long Gamma
Dampens
Dealers sell rallies, buy dips
Short Gamma
Amplifies
Dealers chase price in both directions
gamma flip level
The Flip
Where market character changes
At 2:53 PM on a Wednesday in March, ES futures dropped 18 points in four minutes. Nothing in the news explained it. No Fed speaker, no earnings miss, no geopolitical headline. The move started at 5,720 and accelerated through 5,702 without pausing, then reversed almost as quickly as it began. For traders watching the order flow, the culprit was invisible but predictable: dealers were hedging gamma, and the math forced their hand.
That four-minute episode captures why dealer gamma positioning has become one of the most important structural forces in S&P 500 futures trading. Understanding where dealers sit on the gamma spectrum, and how their hedging behavior amplifies or dampens price movement, gives traders a framework that explains moves the headlines cannot.
How Dealer Gamma Works
Options market makers, commonly called dealers, are in the business of providing liquidity. When a retail or institutional trader buys a call or put, the dealer takes the other side. That transaction leaves the dealer with exposure to price changes, measured by delta, and exposure to changes in delta itself, measured by gamma.
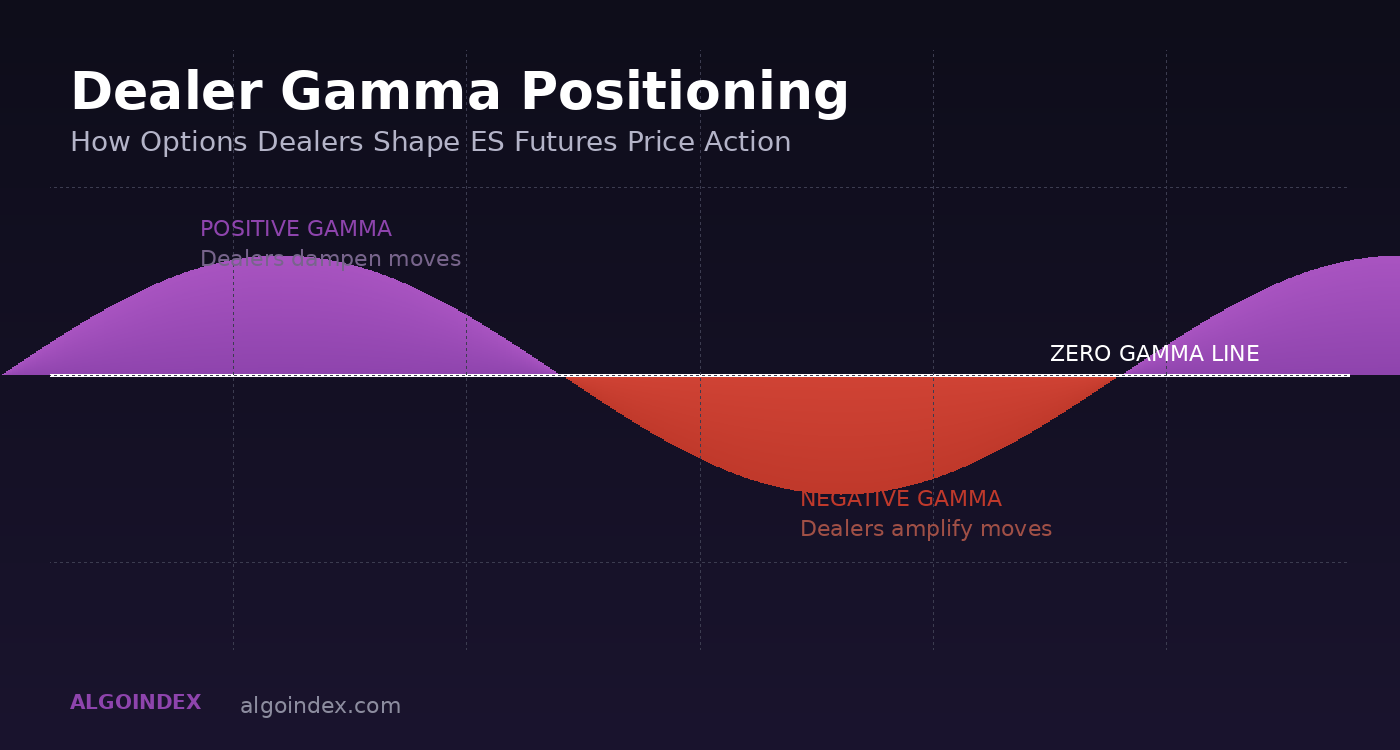
Gamma tells the dealer how fast their directional risk shifts as price moves. When a dealer is long gamma (net positive gamma exposure), their delta naturally adjusts in a stabilizing direction. Price rises, their position gets longer, so they sell futures to rebalance. Price falls, they get shorter, so they buy futures. The result is a dampening effect: long-gamma dealers absorb volatility by trading against the prevailing move.
When dealers are short gamma, the opposite happens. Price rises, their position gets shorter, forcing them to buy futures to hedge. Price falls, they get longer, forcing them to sell. Short-gamma dealers amplify moves because their hedging pushes price further in the direction it is already traveling.
This is not a theory. It is the mechanical consequence of how options Greeks dictate dealer behavior every single day. The distinction between positive and negative gamma environments explains why some sessions grind in a tight range while others produce violent 50-point swings on no apparent catalyst.
The gamma flip level
The most critical level in dealer gamma positioning is the gamma flip level, sometimes called the gamma flip point. This is the price at which aggregate dealer gamma exposure crosses from positive to negative.
Above the gamma flip level, dealers are net long gamma. Their hedging creates a stabilizing force, selling into rallies and buying into dips. Price action tends to be mean-reverting, orderly, and contained within defined ranges. Breakouts fail more often because dealer flow pushes price back toward equilibrium.
Below the gamma flip level, dealers flip to net short gamma. Their hedging amplifies directional moves, and the character of the market changes. Selloffs accelerate because dealer selling compounds with directional selling. Rallies become sharp and short-lived as dealers scramble to cover. Volatility expands, and the probability of outsized daily ranges increases significantly.
For ES futures traders, knowing whether price is above or below the gamma flip level is the single most useful piece of options-derived context available. It does not predict direction, but it predicts the character of the move. A session that opens below the gamma flip level at 5,680 will behave fundamentally differently from one that opens above it, even if every other technical indicator looks identical.
Reading Gamma Levels for Tomorrow’s Session
Dealer gamma positioning is not static. It shifts every day as new options are bought and sold, as existing positions expire, and as the strike prices closest to the current price change. Several key levels beyond the gamma flip level help frame the session:
The volatility inflection level marks the boundary of the volatility environment. Below the volatility inflection level, implied volatility tends to expand, and the market enters a higher-volatility state where statistical expected ranges widen. Above it, volatility compresses and ranges tighten. Many traders use this level as a filter: if price is below the volatility inflection level, they widen stops and targets to account for the expanded movement.
The call wall represents the strike with the highest positive gamma from call options. It acts as a gravitational ceiling, a price level that dealers defend through hedging. Sustained breaks above the call wall are rare because the concentrated positive gamma at that strike absorbs buying pressure.
The put wall is the mirror image on the downside, the strike with the highest negative gamma from puts. It serves as a gravitational support base. When price approaches the put wall, dealer hedging creates buying pressure that supports the market. Breaks below the put wall tend to accelerate because they remove that structural support.
These levels, combined with the gamma flip level, create a map of the session before it begins. A trader who knows that the gamma flip level sits at 5,700, the call wall at 5,800, and the put wall at 5,600 can frame expectations for how far price is likely to travel and how it will behave along the way.
Why This Matters for ES Futures Traders
The practical application is straightforward. In positive gamma environments, fade the extremes. Price that pushes toward the call wall is likely to stall, and dips toward support are likely to find buyers. Mean-reversion strategies outperform in these conditions because dealer hedging creates natural boundaries.
In negative gamma environments, trade with momentum. Breakdowns accelerate, and the dip that looks buyable often becomes a waterfall. The 18-point, four-minute drop described at the top of this article happened in a negative gamma zone, and the speed of the move was a direct consequence of dealers selling into falling prices.
This framework also explains why certain catalysts produce outsized reactions. An FOMC announcement that lands while ES is sitting below the gamma flip level will generate a far larger price swing than the same announcement would produce in a positive gamma environment. The catalyst provides the spark, but dealer positioning determines the size of the fire.
For a deeper exploration of how these structural forces connect to the broader correction risk framework, our analysis in is a market crash really brewing examines the macro conditions that push gamma exposure to extremes. The mechanics described here also drive the kind of institutional put positioning we documented in our ES futures analysis covering the Iran reprieve session, where negative gamma amplified an already volatile geopolitical setup.
To see how gamma exposure interacts with options flow in real-time trading, our guide on how to read gamma exposure (GEX) for trading walks through the practical tools and interpretation methods that translate these concepts into actionable signals.
The gamma flip level sits somewhere on tomorrow’s chart, waiting to define the session’s character before the first trade prints.
Past results are not indicative of future performance. This content is for informational and educational purposes only and does not constitute financial advice or a recommendation to buy or sell any security or futures contract. For our full performance disclosure, visit algoindex.com/performance-statement.
AlgoIndex Research · algoindex.com · Start your free trial
Continue Learning
- How to Read Gamma Exposure (GEX) for Trading – Understand how GEX levels create support and resistance
- How Options Flow Analysis Helps Find Pivots – Real-time options flow for ES futures entry timing
- Market Internals: How to Read TICK, ADD, VOLD, VIX – Breadth and volatility signals for confirmation
- What Are ES Futures? Complete Guide – Foundation concepts for S&P 500 futures trading
Frequently Asked Questions
Dealer gamma positioning refers to the aggregate gamma exposure that options market makers hold from selling options to customers. When dealers are net positive gamma, they must hedge by buying dips and selling rallies, which suppresses volatility and creates a mean-reverting market. When dealers are net negative gamma, they hedge by selling into declines and buying into rallies, which amplifies moves and increases volatility.
The volatility inflection level (volatility inflection level) is the price level where the transition from low-volatility to high-volatility dealer behavior becomes most pronounced. When the index is above the volatility inflection level, dealer hedging activity tends to suppress realized volatility. When below it, dealer hedging amplifies price swings. The volatility inflection level is calculated from the distribution of gamma across strikes and typically sits between the gamma flip level level and the call wall.
Dealers hedge gamma exposure by trading the underlying asset (futures or stock) in response to price changes. With positive gamma, a price drop reduces their delta, so they buy futures to re-hedge (supporting price). A price rise increases their delta, so they sell futures (capping the rally). With negative gamma, the hedging flows reverse: they sell into declines and buy into rallies, creating a feedback loop that amplifies directional moves.
As options approach expiration, their gamma increases dramatically (especially for at-the-money strikes), meaning small price changes require larger dealer hedging adjustments. On expiration day, this concentrated gamma creates sharp, mechanical price movements as dealers rapidly adjust hedges. Additionally, as options expire, the gamma they contributed is removed from the market, which can shift the overall gamma profile from positive to negative, changing market dynamics for the following sessions.
Join the Discussion
Connect with other ES futures and SPY options traders. Share setups, discuss levels, and get real-time market insights from our community.
Join AlgoIndex Trading CommunityRelated guides
- Max Pain Explained: Does Price Really Pin to It?. The strike where option buyers lose the most at expiration, and how often price actually settles there.
- Call Walls and Put Walls: Do They Hold?. The two strikes where dealer gamma concentrates, forward-tested.
- What Is Gamma Exposure (GEX)? for ES Futures. How dealer gamma sets the call wall, put wall and gamma flip.
- What Is QQQ Gamma Exposure (GEX)?. The same gamma read for the Nasdaq 100.
- Market Internals: TICK, ADD, VOLD & VIX. Read breadth and the advance/decline line intraday.
- Cumulative Volume Delta (CVD). Confirm the walls with net aggressive order flow.