
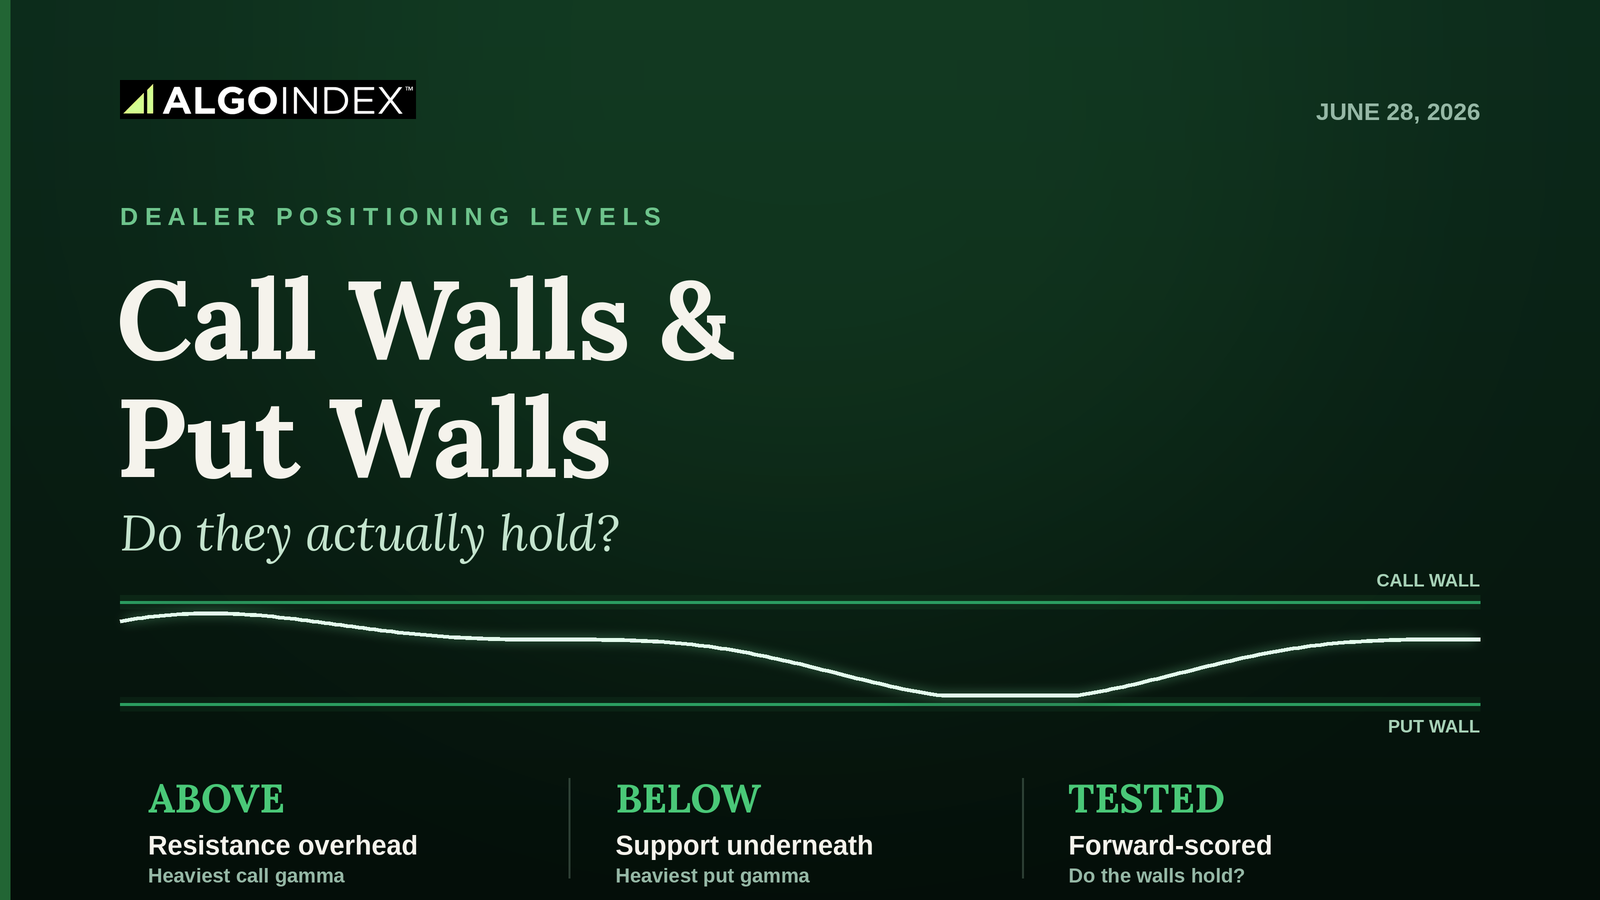
A call wall is the strike above the current price where call option gamma is most heavily concentrated, and it tends to act as resistance. A put wall is the mirror image below price, the strike with the heaviest put gamma, and it tends to act as support. The two often bracket the day, with price boxed between the put wall underneath and the call wall overhead. They are not chart lines drawn by hand; they come from where the options open interest actually sits and how the dealers on the other side have to hedge it.
Every explainer on the internet will tell you that. Here is the question almost none of them answer: do these walls actually hold? It is easy to publish a number and call it support. It is much harder to go back, day after day, and check whether price respected the level or sliced straight through it. That test is the whole point, and it is the one thing a static dashboard never shows you.
So we built it. AlgoIndex marks the call and put walls before each session and then scores, after the fact, whether each level actually acted as support or resistance, and publishes the running hit rate in our gamma level accuracy tracker. In the current forward-tested sample, call walls have held about 3 in 4 times they were tested, and put walls closer to 3 in 5, strong tendencies, not certainties; the put wall holding less often than the call wall is itself a signal, since downside levels break more easily than upside ones. The rest of this guide explains what the walls are and how to use them, with the honest caveat, backed by that forward-tested data, that they are a probability, not a guarantee.
What a call wall is
A call wall sits above the current price at the strike carrying the largest concentration of call gamma. Dealers who sold those calls are typically long gamma around that strike, which means to stay hedged they sell as price rises toward it and buy as it falls away. That hedging leans against an advance, so rallies tend to slow, stall, or reverse as they approach the call wall. In practice it behaves like a ceiling: a level the market keeps testing from below and struggles to close above.
What a put wall is
A put wall is the same idea on the downside, the strike below price with the heaviest put gamma. Dealer hedging there tends to cushion declines, buying as price drops toward the wall, so selloffs often decelerate or bounce as they reach it. It behaves like a support base the market leans on. On June 26 our S&P review flagged exactly this setup, where a put wall capped the downside as a failed breakout rolled over, the kind of real example we document in the daily reviews rather than describe in the abstract.
Why the walls act as magnets
The walls are not magic numbers. They work because of dealer hedging, the same force behind every gamma level. When dealers are net long gamma around a strike, their hedging is stabilizing, selling strength and buying weakness, which pins price near the wall and keeps the range quiet. When they are net short gamma, the hedging flips to destabilizing, buying strength and selling weakness, and a wall that should have held instead gives way and the move accelerates through it. That single distinction, long gamma versus short gamma, is why the same wall acts as a brick ceiling one day and shatters the next.
The deeper mechanics live in our guide to gamma exposure (GEX) and dealer gamma positioning. The walls are simply the two most important strikes that machinery produces.
Do they actually hold? The forward-tested answer
This is where we part ways with the tool dashboards. Marking a wall is the easy half. The honest half is grading it: when price reached the level, did it respect it or break it? We score every gamma level that way and publish the running result, so the claim that walls act as support and resistance stops being a slogan and becomes a measured hit rate you can check.
The honest takeaway from running that test is that the walls are a strong tendency, not a wall in the literal sense. They hold often enough to be one of the most useful levels on the chart, and they break often enough that you never bet the account on one. The value is in knowing the odds, which is exactly what the tracker is for.
How to use the walls
Three uses do most of the work. First, as support and resistance: fade moves into a wall when the broader read says the day is range-bound, taking profit at the opposite wall. Second, as a breakout signal: a decisive close through a wall is information, because it usually means dealer positioning has flipped and the level that should have held just failed, which often precedes continuation rather than reversal. Third, as context for the gamma flip, the price zone where dealer hedging switches from stabilizing to destabilizing; walls tend to hold cleanly above the flip and break more easily below it. One caveat ties it together: the walls are not fixed. They move as positioning changes through the day and they roll off entirely at options expiration, so a wall that defined yesterday can be gone today. We cover that expiration effect in the monthly OPEX guide.
A call wall and a put wall are the two strikes where the options market has quietly drawn the day's likely boundaries. Treat them as the highest-probability levels on the chart, respect a clean break as a change of character, and trust the tracked hit rate over anyone's confident story about a number.
Frequently Asked Questions
A call wall is the strike above the current price with the largest concentration of call gamma. Dealer hedging around it tends to slow or reverse rallies, so it often acts as resistance, a ceiling the market tests from below.
What is a put wall?A put wall is the strike below the current price with the heaviest put gamma. Dealer hedging there tends to cushion declines, so it often acts as support, a base that selloffs lean on and frequently bounce from.
Do call walls and put walls actually work?They work as a strong tendency, not a guarantee. We forward-test it: we mark the walls before each session, then score whether price respected each level, and publish the running hit rate in our gamma level accuracy tracker. They hold often enough to be useful and break often enough that they should be traded as probabilities, not certainties.
What is the difference between a call wall and regular resistance?Regular resistance is drawn from past price action. A call wall is derived from current options positioning and the dealer hedging it forces. It can act as resistance even at a level that has no prior price history, because the pressure comes from hedging flow, not from memory of past trades.
How do I find the call wall and put wall?They come from the options gamma profile, the call wall being the heaviest call-gamma strike above price and the put wall the heaviest put-gamma strike below it. AlgoIndex computes and publishes them each session, with the levels scored for accuracy over time.
Trade the walls that actually hold.
AlgoIndex publishes the call and put walls each session and scores whether they held. See the live numbers in the gamma level accuracy tracker, the methodology in the performance statement, then view pricing.
Related: max pain, gamma exposure (GEX), dealer gamma positioning, and QQQ gamma exposure, and cumulative volume delta (CVD), and value area and VPOC.
Related tools
- NVDA gamma exposure tool: see NVIDIA live call wall and put wall, graded forward-only after every close.
- TSLA call wall and put wall tool: see Tesla live options walls and gamma flip, updated each session.
If you want to see whether these wall levels actually held for your own trades, log them in the free AI trading journal and let the coach grade each one. No card required.



