
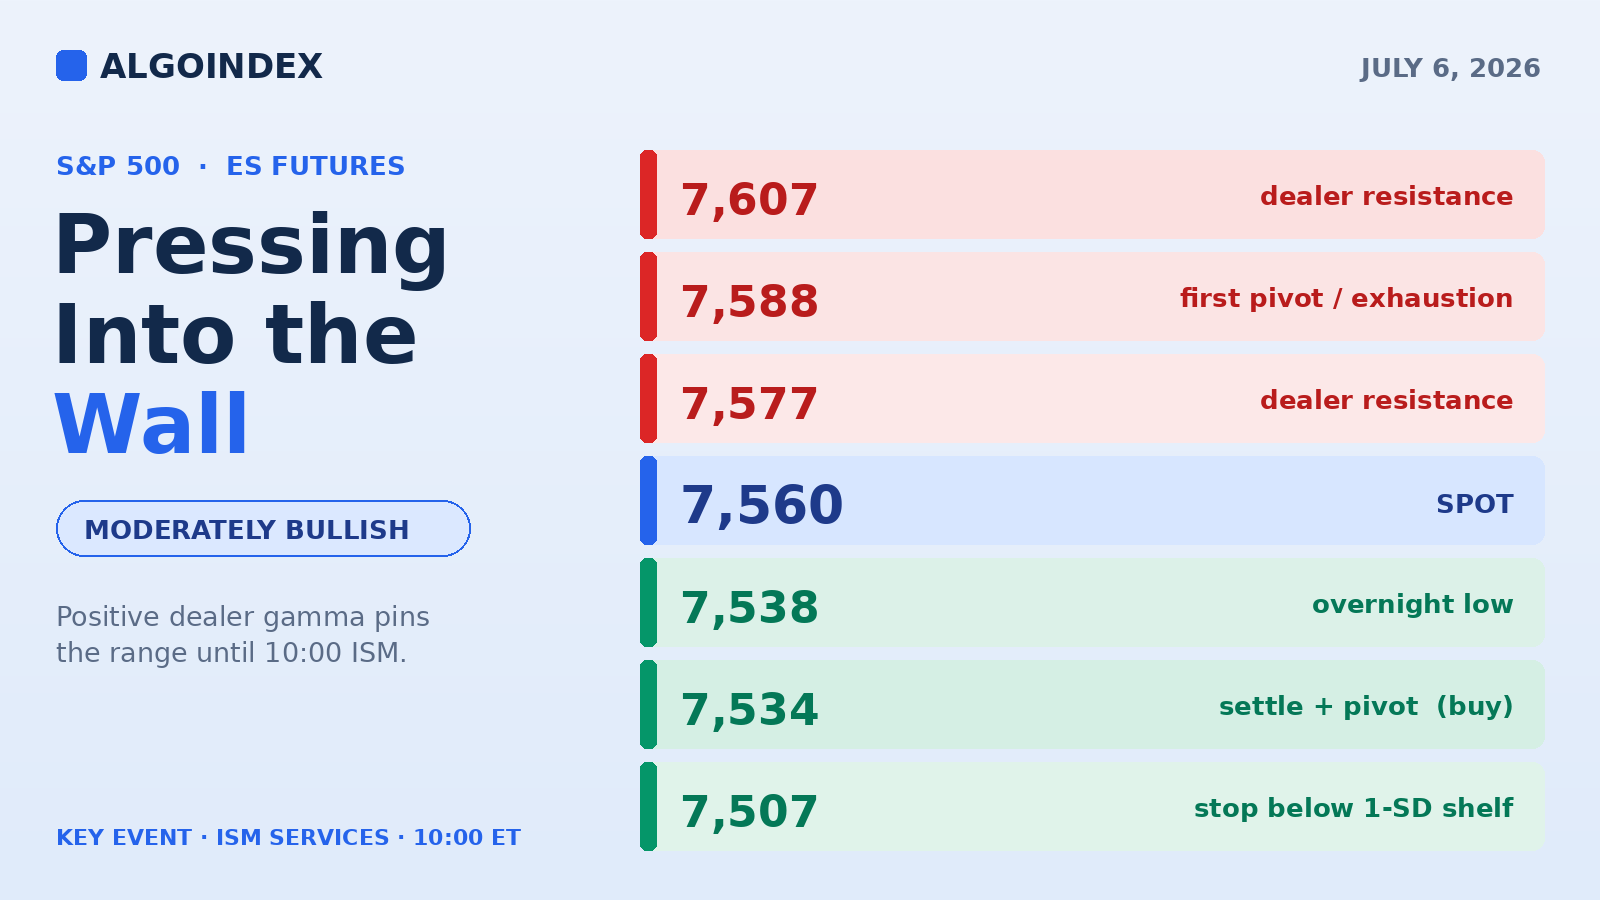
ES returns from the July 4 weekend near 7,560, up about 0.43 percent, pressing straight into the first shelf of dealer-positioning resistance at 7,565 to 7,607. Dealer gamma is net positive, which pins the market until a catalyst forces a repricing, and the 10:00 ET ISM services survey, its prices-paid line in particular, is that catalyst. The plan: buy the 7,530 to 7,540 support shelf, fade the 7,588 to 7,607 stack, and stand aside on a hot prices-paid print. Bias moderately bullish, conviction moderate.
At 7,574.25 overnight, ES tagged the exact ceiling it ran into last week and stopped. We flagged 7,575 in Thursday's note as the level the dovish-jobs rally could not clear. The market spent a long weekend away and reopened right back underneath it, near 7,560, higher by roughly 0.43 percent off Thursday's 7,528.25 settle, after a Globex range of 7,538.25 to 7,574.25 on 231,000 contracts.
The session ahead turns on a single survey line. At 10:00 ET the ISM services report lands, headline consensus 54.0 against 54.5 prior, with the prices-paid component expected to cool from 71.3 to 67.5. That number can move rates, the dollar, and equities together, and the desks flagged it a week ago as the key date of the week. Everything before it is positioning. Everything after is the reaction.
A recovering pullback that still carries a scar
Thursday, July 2 closed at 7,528.25 after a wide, payrolls-driven session. The cash index traded a 150-basis-point range and closed at 7,483.24, an early selloff finding buyers at cash 7,400 and bouncing into the close. Index cumulative delta swung from roughly negative 6 billion dollars after the open to positive 5 billion into the bell, about 11 billion of net afternoon buying, an unusually supportive flow signature into a long weekend. Overnight, price opened 7,554.75, printed 7,574.25, dipped to 7,538.25, and settled near 7,560, the tone set by a Nasdaq rebound as chip names recovered.
On the daily chart, ES sits in the upper third of its monthly range but below the mid-June swing highs. The 52-week and 13-week high stands at 7,693.75, the one-month high at 7,648.75, the one-month low at 7,292.25. Current price near 7,560 sits roughly 130 points below the monthly high and 270 above the monthly low. One number still nags the bulls: the 20-day change reads negative 1.36 percent, so even after last week's recovery the market trades below where it was in early-to-mid June. Price is up 2.14 percent over five sessions, up 4.62 percent over 50 days, up 8.11 percent year-to-date. The recovery is real. The repair is not finished.
The moving-average stack is fully bullish, price above the 5-day (7,536.05), the 20-day (7,493.89), the 50-day (7,477.46), the 100-day (7,177.11), and the 200-day (7,077.86). The 5-day has crossed back above the 20-day and 50-day, confirming the short-term recovery. Momentum is the holdout. The 14-day directional index sits at 20.00 with the down-line (19.68) still above the up-line (15.87), so the recent bounce has not flipped the daily balance. The 9-day stochastic at 85.73 percent is stretched on the fastest measure, while the 14-day (69.55) and 20-day (74.27) are firm without being extreme. The multi-indicator composite reads 56 percent buy, and the hesitation lives at the front of the curve, short-term indicators average only 40 percent buy against 75 percent medium-term and 67 percent long-term.
Positive dealer gamma sets the tempo
Here is the structural feature that decides the morning. ES is pressing into the first layer of dealer resistance right now. The cash 7,500 equivalent, ES near 7,557, is being tested pre-open, with heavier supply stacked at 7,577, 7,588, and 7,607. Dealer gamma on the index is net positive, roughly 5.4 billion in call gamma against negative 0.9 billion in puts, which mechanically dampens intraday swings as desks fade the moves. That is the pinning environment, quiet until a catalyst forces a repricing. High-volatility positioning sits well above price near cash 7,780, and the top gamma expiration is August 20, so the flow that matters this week lives in the front expirations where zero-days-to-expiry activity will amplify whichever direction wins the 10:00 reaction.
The options surface is telling. Implied volatility at 13.4 percent sits four points under 20-day realized at 17.0 percent, and the implied-volatility rank near 20 percent puts index options in the cheapest quintile of their one-year range. Yet the skew rank near 74 percent means the market is paying up for crash protection while refusing to pay for movement. The put/call open-interest ratio reads 1.27, the one-month correlation gauge near 5 marks a dispersion extreme, and the implied move for the session is roughly 63 cash handles. Options are cheap. Somebody is going to want them by the close.
"With dealers long gamma, the default is pinning between the big strikes at cash 7,500 to 7,550. It stays quiet until the data forces a repricing."
The cash index is the primary flow surface. The dealer map carried into today: resistance at cash 7,500, 7,520, 7,550, and 7,600, the bull/bear pivot at 7,380, support at 7,400, 7,380, and 7,300. Price opens the week straddling the first of those, cash near 7,509 against the 7,500 level, which makes the open a direct referendum on whether the market can accept above the biggest near-term strike. Thursday's hedging flow was constructive on the index even as single-stock flow was negative on aggressive call selling in the largest names, the split that matches the dispersion reading.
A dollar, a rotation, and a tail nobody scheduled
The dollar's strength is the clearest macro trend into the week. Sell-side desks cut euro-dollar forecasts to 1.14, 1.12, and 1.12 over three, six, and twelve months and lifted dollar-yen projections to 162, 163, and 165, arguing the data-center capital-spending boom and an energy supply squeeze have re-rated US assets. Overnight wires flagged suspected yen-buying operations by Japanese authorities after the currency touched a 40-year low. On policy, Thursday's 57,000 payrolls print against a 113,000 consensus and a monthly inflation reading a tenth below forecast both lean dovish, and the new leadership has framed the artificial-intelligence build-out as a significant disinflationary force. Wednesday's Fed meeting minutes are the week's main policy read; today, an 11:00 ET governor speech is the only scheduled central-bank voice.
Beneath a flat index surface, Thursday's rotation was violent. The semiconductor group fell 5 to 6 percent while healthcare gained 3 percent and financials 2 percent. This morning the chip complex is rebounding, helped by a 90-day upside catalyst watch on a major memory name and anticipation around Korean memory earnings. A large index provider adds a newly public rocket-and-satellite company to its 100-name benchmark on July 7 with passive index buying expected around inclusion. A major hardware maker raising prices on memory and storage is a small but real sign that component costs are firming, not deflating. Whether today's gains hold depends on whether the semiconductor rebound broadens into the megacap complex or Thursday's profit-taking resumes.
The fattest tail is not on the calendar. Overnight reports described US military strikes near the Strait of Hormuz, one-way attack drones fired at shipping, and phone alerts in the UAE warning of missile threats, with France deploying mine-countermeasure assets. Crude near 68.70, slightly lower, is telling you the energy market treats the shipping threat as contained. An escalation headline, a tanker sunk, strikes on Iranian territory, US casualties, would reprice risk assets quickly and suspends the setup below regardless of level. Cross-asset, gold trades near 4,154, up 0.8 percent, quietly bidding for a hedge, and the vol-of-vol gauge sits in the high 80s, muted hedging demand overall.
The trade: buy the shelf, respect the wall
The plan writes itself off the strongest shelf on the board. Buy the first pullback into 7,530 to 7,540, where Thursday's settle (7,528.25), the daily pivot (7,533.83), and the overnight low (7,538.25) stack together, ideal fill near 7,534. Stop 7,507, below the 7,513 stall marker, the 7,505 one-standard-deviation support, and the 7,500 handle. Targets 7,574, then 7,588, then 7,607. From a 7,535 blended entry on 28-point risk that is roughly 1:1.4 at T1, 1:1.9 at T2, 1:2.6 at T3. Invalidation is a 15-minute close below 7,507, or a hot prices-paid print at 10:00 that forces immediate acceptance below 7,528. Do not catch the knife through the shelf on a data repricing.
The alternate is the counter-trend fade: short a first-touch rejection of the 7,588 to 7,607 resistance stack, triggered on a failed 15-minute breakout with a lower high, stop 7,622, targets 7,560 and 7,535. Take it only with clear rejection structure. Skip both if price opens below 7,528 and holds there, the shelf is already broken and the map changes, and skip if the morning pins between 7,545 and 7,565 on shrinking range, that is the positive-gamma signature and the edge is gone.
Today's economic calendar (ET). The 10:00 ISM prices-paid line is the single market-moving cell.
Base-case distribution for the RTH session. A hot prices-paid print raises the weight on B and C.
The market has momentum from the tech rebound and is pressing into layered resistance with the fastest oscillators stretched and the positioning desks leaning the other way. One survey line decides which side wins.
The complete data picture
Every level and reading from the morning ES review, top to bottom. Nothing rounded away.
| Resistance (top to bottom) | Support (top to bottom) |
|---|---|
| 7,702 third pivot resistance | 7,550 to 7,557 cash 7,500 equivalent (pivotal) |
| 7,693.75 52-week and 13-week high | 7,538 overnight low, character-of-change |
| 7,648 to 7,657 one-month high 7,648.75, second pivot 7,648.08, cash 7,600 | 7,528 to 7,534 settle 7,528.25, daily pivot 7,533.83 |
| 7,607 cash 7,550 dealer resistance | 7,505 to 7,513 one-SD 7,505.23, stochastic stall 7,513.25 |
| 7,588 first pivot 7,588.17, exhaustion 7,590.45 | 7,474 first pivot 7,473.92, 50% retrace 7,470.50 |
| 7,577 dealer resistance | 7,457 cash 7,400 dealer support |
| 7,565 to 7,574 overnight high, cash 7,508 to 7,517 | 7,437 cash 7,380 bull/bear pivot; 7,420 second pivot; 7,357 to 7,360 third pivot, cash 7,300 |
Moving averages: 5-day 7,536.05, 20-day 7,493.89, 50-day 7,477.46, 100-day 7,177.11, 200-day 7,077.86. Performance: +2.14% (5d), -1.36% (20d), +4.62% (50d), +7.03% (100d), +8.11% YTD. Range: one-month high 7,648.75, one-month low 7,292.25; high-vol positioning near cash 7,780; top gamma expiration August 20.
Intraday prints: overnight open 7,554.75, high 7,574.25, low 7,538.25, near 7,560, volume roughly 231K. Thursday cash close 7,483.24 on a 150-basis-point range; index cumulative-delta swing from negative 6 billion to positive 5 billion, roughly 11 billion of net afternoon buying. Expected range: low 7,505 to 7,525, mid 7,545 to 7,590, high 7,607 to 7,630; cash-index implied envelope 7,446 to 7,572 (ES roughly 7,503 to 7,629). Dealer map (cash): resistance 7,500 / 7,520 / 7,550 / 7,600; bull/bear pivot 7,380; support 7,400 / 7,380 / 7,300.
Paths: A grind 50% (accept above 7,557, test 7,577 to 7,588, close 7,565 to 7,600); B rejection 30% (fail 7,574 to 7,588, fade to 7,528 to 7,538, close 7,530 to 7,560); C risk-off break 20% (break 7,528, extend through 7,505 toward 7,474). Setup: long 7,530 to 7,540 (ideal 7,534), stop 7,507, T1 7,574, T2 7,588, T3 7,607, R:R 1:1.4 / 1:1.9 / 1:2.6 on 28-point risk. Alternate: short a first-touch rejection of 7,588 to 7,607, stop 7,622, targets 7,560 and 7,535. Macro override: any confirmed Strait-of-Hormuz escalation headline suspends the setup regardless of level. Calendar (ET): 09:45 S&P services PMI final (prior 51.3) + composite PMI final (prior 52.2); 10:00 ISM services PMI (54.0 vs 54.5), prices paid (67.5 vs 71.3), employment (prior 47.9); 11:00 Fed governor speech; 12:00 ECB president; 12:45 BoE speaker; 14:30 ECB chief economist; Wednesday Fed minutes 14:00.
One survey line, one wall of dealer resistance.
See how AlgoIndex turns this kind of read into systematic signals. Read today's Nasdaq note and the pillar on how dealer call and put walls actually behave.
View pricingUpdate: July 7: the S&P rotates a semiconductor shock instead of wearing it.



