
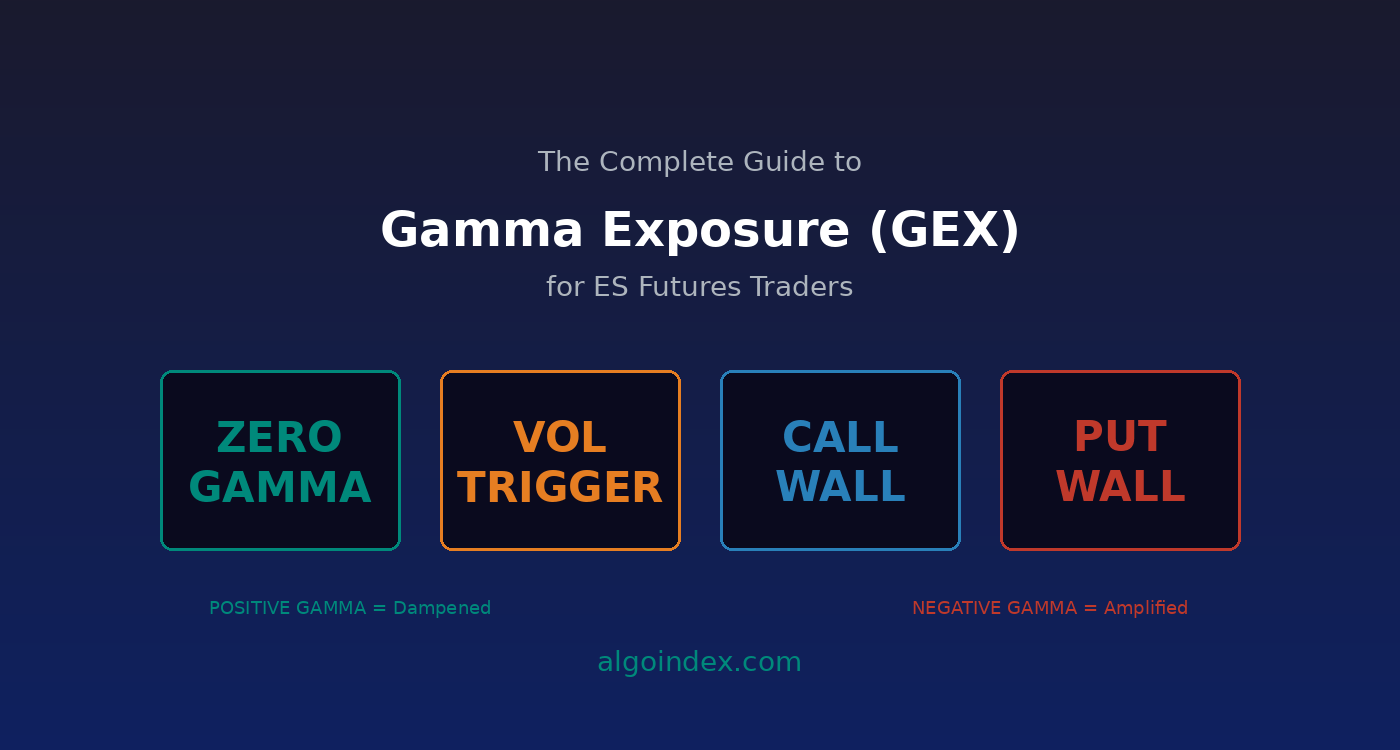
Gamma exposure (GEX) measures the total options gamma that dealers, the market makers, hold across all strikes for the S&P 500 and its ETFs. It maps where dealer hedging will add buying pressure, selling pressure, or a pull toward a strike. In positive gamma, dealers dampen moves and price tends to mean-revert; in negative gamma, dealers amplify moves and daily ranges expand. Knowing where gamma flips tells ES futures traders where price is likely to accelerate or stall.
Do dealer-gamma levels actually hold? Our forward-tested data
Most guides to gamma exposure stop at the theory. The harder question for a trader is simple: when price reaches a dealer-positioning level, does the level actually do anything? We publish the answer in real time. Our gamma-level accuracy tracker scores every key level the moment the session closes, forward only, with no cherry-picking. Here is what the early sample shows for the S&P 500 complex.
| Level type | Held when tested |
|---|---|
| Prior-day high | 83% |
| Call wall | 78% |
| Value-area high | 82% |
| Expected-range edge | 73% |
| Key gamma | 68% |
| Gamma flip | 75% |
| Volume point of control | 69% |
| Put wall | 61% |
| Value-area low | 59% |
| Prior-day low | 49% |
| All tested levels | 70% |
Sample: 676 tested levels across ES, SPX and SPY, forward-scored daily since June 3, 2026 (figures as of July 6, 2026). The sample grows every session, and the live numbers are on the tracker, updated daily.
Two things stand out. First, the levels are not equal. Call walls, the prior-day high and the value-area high acted as resistance or support more than four times in five, while the prior-day low held far less often. Knowing which level you are leaning on matters as much as knowing where it sits. Second, the core gamma levels, the gamma flip and the key-gamma area, held close to seven times in ten, which is why they anchor our intraday plan.
A real session: ES, June 12, 2026
Positive-gamma days tend to compress inside the dealer levels rather than trend through them, and June 12 was a clean example. ES opened inside positive gamma. On the dip, the session low of 7,429 stopped just above the put wall at 7,416 and held the gamma-flip area near 7,470. On the push higher, the session high of 7,525 ran into the call-wall and key-gamma band near 7,516 and faded, with price closing at 7,501. Both the downside gamma support and the upside call-wall resistance did their job, and the range stayed contained, exactly what positive gamma predicts.
That is the difference between reading a definition of gamma exposure and trading it. The level is only useful if you know how often it holds, and we measure that publicly. See the live numbers on the S&P 500 Gamma Level Accuracy Tracker.
On the morning of March 20, 2026, ES futures opened at 5,680 and within ninety minutes had dropped 45 points to test the 5,635 level. The speed of the decline surprised many traders, but the options data had been signaling this exact scenario for two days. Gamma exposure had flipped negative at the 5,700 strike, meaning every point lower would trigger additional dealer selling that amplified the move. Traders who understood where the gamma flip occurred were positioned ahead of the cascade. Those who only watched price were caught selling into a move that was already extended.
Understanding gamma exposure is not about predicting direction. It is about understanding the mechanics that accelerate or dampen price movement, and using that knowledge to identify where the market is most likely to move fast, where it is likely to stall, and where the highest-conviction entries form.
What Is Gamma Exposure and Why Does It Matter for ES Futures?
Gamma exposure, commonly abbreviated as GEX, measures the total gamma that options market makers (dealers) hold across all strikes and expirations for a given instrument. Gamma itself is the rate of change of delta, which means it tells you how much a dealer’s hedging obligation changes for every one-point move in the underlying price.
When you buy a call option, the market maker who sold it to you must hedge by buying shares or futures. As the underlying moves higher, the dealer needs to buy more (their delta exposure increases). As it moves lower, they need to sell some of their hedge. The rate at which this hedging adjustment happens is gamma.
GEX aggregates this across every open options contract on the S&P 500 and its derivatives (SPX, SPY, ES). The result is a map of where dealer hedging will create buying pressure, selling pressure, or gravitational pull at specific price levels.
For ES futures traders, GEX provides something no technical indicator can: a forward-looking view of where price is mechanically likely to accelerate, decelerate, or reverse. Technical analysis tells you where price has been. GEX tells you where the options market structure will push price next.
Positive vs Negative Gamma: The Two Market Environments
The single most important concept in gamma exposure is whether the market is trading in a positive or negative gamma environment. This distinction fundamentally changes how price behaves.
When the index trades above the gamma flip level level, dealers hold net positive gamma. Dealers must buy when price falls and sell when price rises, creating a natural dampening effect. Think of it as a rubber band pulling price back toward the center. Daily ranges compress, price action mean-reverts, and breakouts tend to fail.
When the index trades below the gamma flip level level, the dynamics invert. Dealers must sell when price falls and buy when price rises, amplifying moves instead of dampening them. A 10-point decline triggers dealer selling, which pushes price lower, triggering more selling in a cascading feedback loop. Daily ranges expand to 50-100+ points.
For ES futures day traders, positive gamma environments favor range-bound strategies: selling resistance, buying support, and expecting mean reversion. Negative gamma environments favor momentum and trend-following: shorting breakdowns, buying breakouts, and expecting acceleration rather than reversal.
Key GEX Levels Every ES Futures Trader Should Know
Options data providers calculate several critical levels from the aggregate gamma exposure profile. Each serves a specific purpose in understanding where price is likely to behave differently.
gamma flip level Level: The price at which aggregate dealer gamma flips from positive to negative. THE critical inflection point. Above it, dealers dampen moves. Below it, dealers amplify moves.
volatility inflection level: An early warning boundary above gamma flip level. When ES drops below the volatility inflection level, daily ranges expand and intraday swings become larger, even before full negative gamma activates.
Hedge Wall: The strike with the largest concentration of dealer hedging. Acts as a strong gravitational level that pins price nearby. Use it as a mean reversion target.
Call Wall: The strike with the highest positive gamma from calls. Creates a resistance ceiling for the current expiration cycle.
Put Wall: The strike with the highest negative gamma from puts. Creates a support boundary for the current expiration cycle.
Together, the call wall and put wall define the expected trading range based on options positioning. In most sessions, ES trades within these boundaries unless a significant catalyst forces a breakout. When price does breach the call wall or put wall, it often triggers rapid repositioning that redefines the range for subsequent sessions.
How Gamma Exposure Changes Around Key Events
GEX is not static. The gamma profile shifts throughout the day, week, and expiration cycle. Understanding these dynamics helps ES futures traders anticipate when conditions will change.
Expiration Cycles and Gamma Decay: As options approach expiration, gamma concentrates at strikes near the current price and increases in magnitude. Monthly options expiration (OPEX) days are particularly significant. The large amount of gamma rolling off at expiration can cause a “gamma unpin” where price breaks free from the gravitational pull of heavily populated strikes. ES futures traders should expect wider ranges and potential trend days immediately following major expirations.
0DTE Gamma: The sharp growth of zero-day-to-expiration options has added a new dimension to gamma analysis. 0DTE contracts have extremely high gamma near the current price because they expire the same day. During sessions with heavy 0DTE volume, intraday gamma effects can dominate longer-dated positioning, producing sharp intraday reversals at levels that did not exist when the session began.
Major catalysts like FOMC announcements, CPI releases, and mega-cap earnings cause rapid repositioning of options contracts. Before these events, traders buy protective options (puts and straddles), shifting gamma toward negative territory. After a benign outcome, the unwinding of protection can rapidly flip gamma back to positive. This is why FOMC and CPI sessions often see the most dramatic transitions in market character within a single day.
Combining GEX with Price Action for High-Conviction Setups
Gamma exposure data is most powerful when combined with traditional technical analysis and real-time options flow data. Here is how professional ES futures traders integrate GEX into their process:
Fade at Call Wall in Positive Gamma: When ES rallies to the call wall in a positive gamma environment and market internals show exhaustion (TICK failing, ADD flattening), the probability of reversal is elevated.
Momentum Below gamma flip level: When ES breaks below gamma flip level with confirming breadth (negative ADD, negative VOLD), the negative gamma feedback loop suggests the decline will accelerate. Short rallies to overhead levels.
Gamma Unpin After OPEX: In the first two sessions after major monthly expiration, the old gamma profile dissolves. If new positioning shows a significant shift, ES has room to trend in the direction of the repositioning.
volatility inflection level Break with VIX Confirmation: When ES breaks below the volatility inflection level and VIX is simultaneously rising, both the options structure and the volatility market confirm expanding risk.
Practical Application: Reading the Daily GEX Profile
Before each trading session, review the current GEX profile and note these five data points: Where is gamma flip level relative to the current ES price? Where is the volatility inflection level? What is the implied one-day move? Where are the call wall and put wall? Has the gamma profile shifted from yesterday?
A rising gamma flip level level suggests improving conditions. A falling gamma flip level level suggests deteriorating conditions. The direction of change is often more informative than the absolute level.
If you are new to ES futures trading, our beginner’s guide covers contract mechanics and margin requirements. For traders looking to understand how dealer gamma positioning creates these dynamics at the institutional level, that guide provides the theoretical foundation for the practical framework described here.
Gamma exposure gives ES futures traders something invaluable: a structural view of where the market is mechanically biased to move. It does not replace technical analysis or discretionary judgment. But in a market increasingly driven by options mechanics and algorithmic hedging flows, understanding the gamma landscape is the difference between trading with the structure and trading against it.
Disclaimer: This content is for educational purposes only and does not constitute financial advice. Trading futures involves substantial risk of loss. Past performance does not guarantee future results. See our performance statement for details. Ready to see how algorithmic signals work in practice? Explore AlgoIndex plans.
Frequently Asked Questions
Gamma exposure (GEX) measures the total gamma that options market makers hold across all strikes and expirations. It creates a map of where dealer hedging will produce buying pressure, selling pressure, or gravitational pull at specific price levels. When GEX is positive at a price level, dealer hedging dampens moves. When negative, it amplifies them.
The gamma flip level level is the price at which aggregate dealer gamma flips from positive to negative. Above it, dealers dampen price moves by buying dips and selling rallies. Below it, dealers amplify moves by selling into declines and buying into rallies. It is the single most important level derived from options data for ES futures traders.
In positive gamma environments, daily ranges compress and price mean-reverts, favoring range-bound strategies like selling resistance and buying support. In negative gamma environments, daily ranges expand dramatically (50-100+ points) and moves accelerate, favoring momentum and trend-following strategies.
The call wall is the strike with the highest positive gamma from call options, creating a resistance ceiling. The put wall is the strike with the highest negative gamma from put options, creating a support boundary. Together they define the expected trading range for the current expiration cycle.
Zero-day-to-expiration (0DTE) options have extremely high gamma near the current price because they expire the same day. During heavy 0DTE sessions, intraday gamma effects can dominate longer-dated positioning, producing sharp reversals at levels that did not exist when the session began.
Join the Discussion
Connect with other ES futures and SPY options traders. Share setups, discuss levels, and get real-time market insights from our community.
Join AlgoIndex Trading CommunityRelated guides
- Call Walls and Put Walls: Do They Hold?. The two strikes where dealer gamma concentrates, forward-tested.
- What Is QQQ Gamma Exposure (GEX)?. The same gamma read for the Nasdaq 100.
- What Is Dealer Gamma Positioning?. Why dealers buy weakness and sell strength.
- Market Internals: TICK, ADD, VOLD & VIX. Read breadth and the advance/decline line intraday.
- ES, NQ, MES & MNQ Contract Specs & Point Value. Point value, tick value and margin for every contract.
- Futures Market Hours. When ES, NQ and the S&P 500 actually trade.
- Triple Witching Explained. The quarterly expiration sessions and what they do to volume.
Related tools
- NVDA gamma exposure tool: live call wall, put wall, gamma flip and max pain for NVIDIA, computed from the option chain each session and graded forward-only.
- TSLA gamma exposure tool: live gamma levels and max pain for Tesla, updated each session.
If you want to see whether these gamma levels actually helped your own trades, log them in the free AI trading journal and let the coach grade each one. No card required.



