
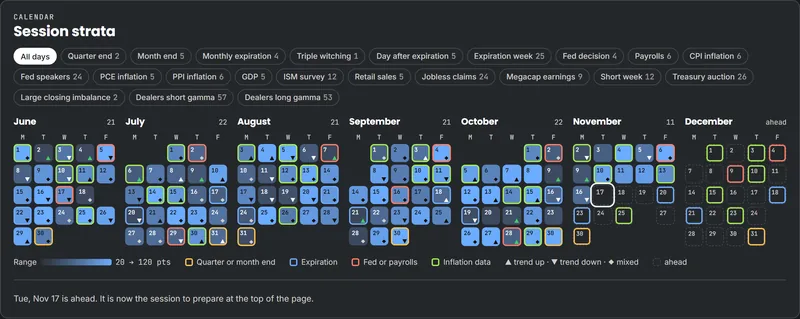
Session Calendar Heatmap
Every session on one calendar, shaded by how wide the day traveled and outlined by day type. Filter it to a single day type with one tap.
What kind of day is it?
Every trading day has a shape. Study the one ahead before it starts.
Some days trend from the open. Some spend the morning going nowhere and move late. Days that land on a data release, a quarter end or an expiration tend to behave like each other. Session Patterns files every ES session by its day types and its shape, then opens on the next session worth preparing for.
Illustration. Drawn shapes, not measured sessions.
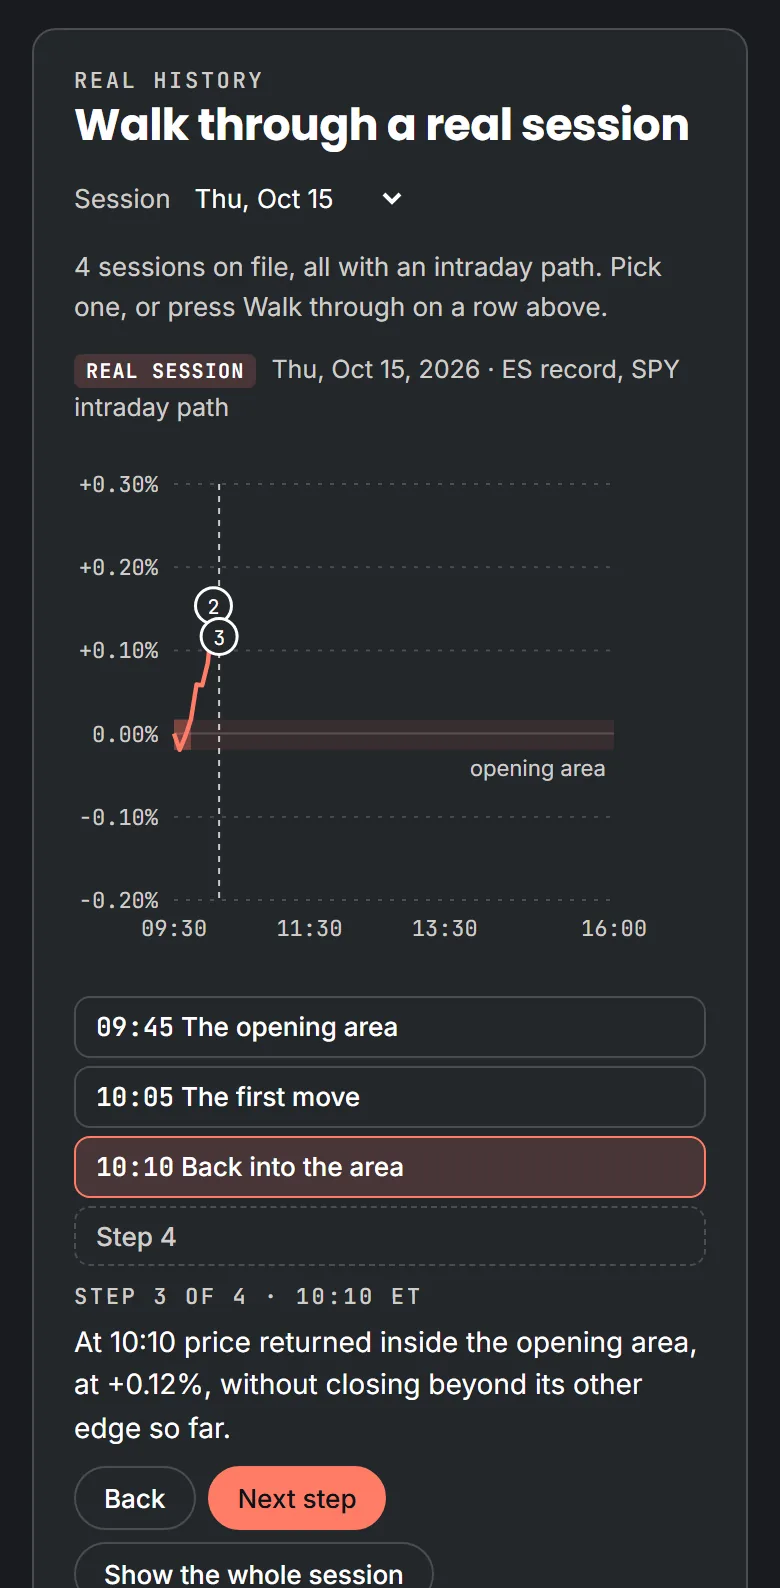
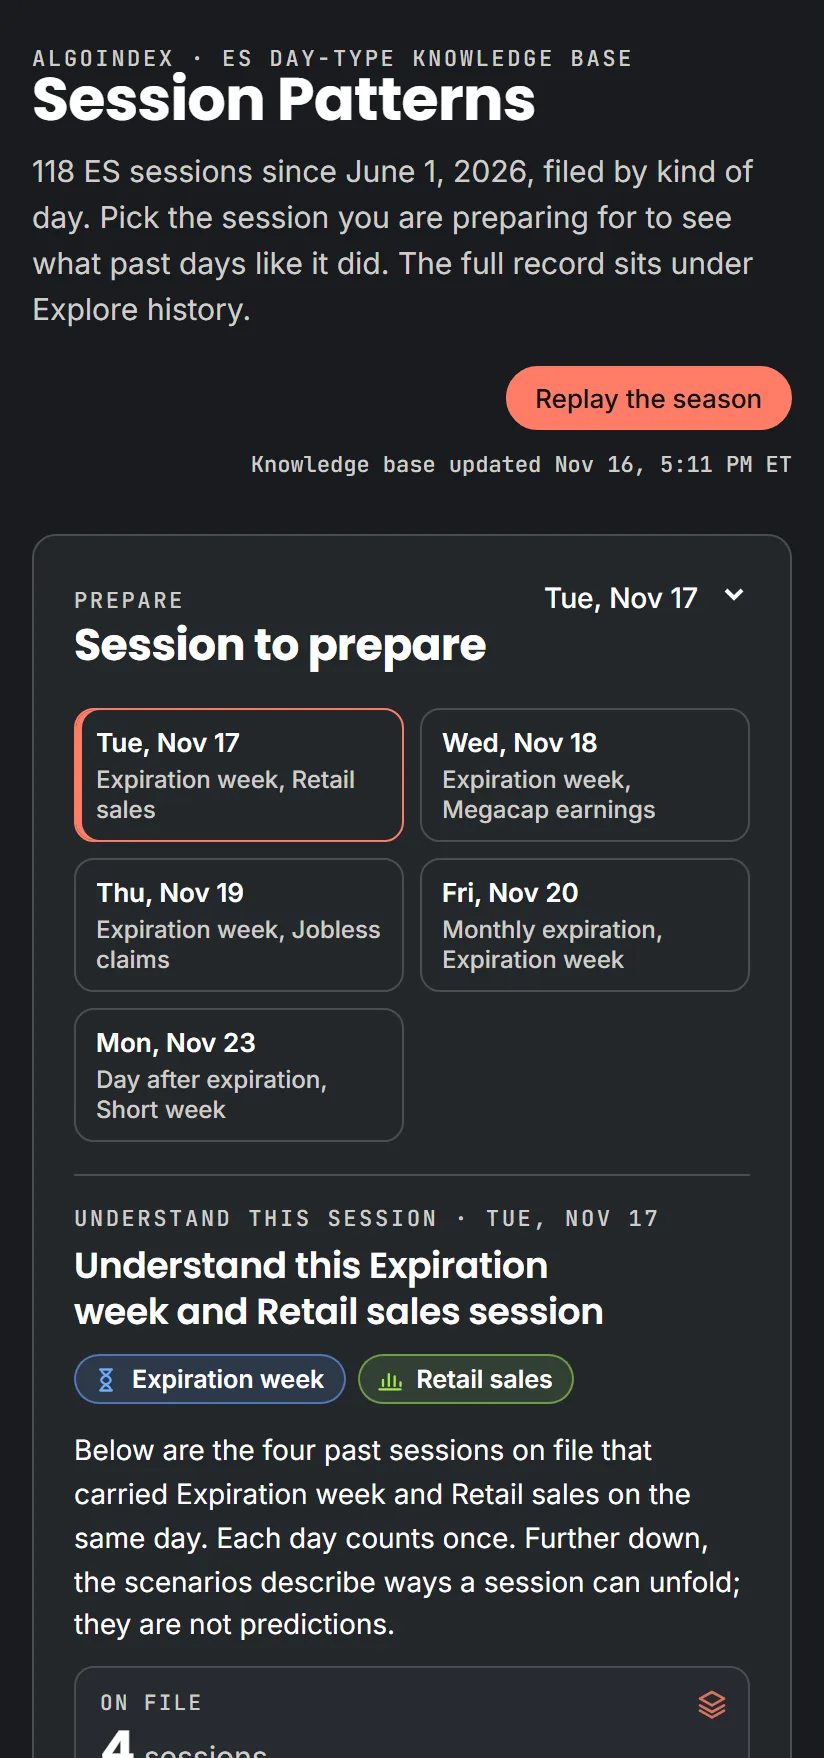
Session Patterns is in the members dashboard and in the AlgoIndex app for iPhone and Android. The six questions below follow the page from top to bottom and show each area on a large screen and on a phone.
Next-Session Briefing
The page opens on the next session that carries a day type and names it: payrolls, inflation data, a Fed decision, an expiration, month end and more. Pick any of the sessions coming up and the whole page follows.
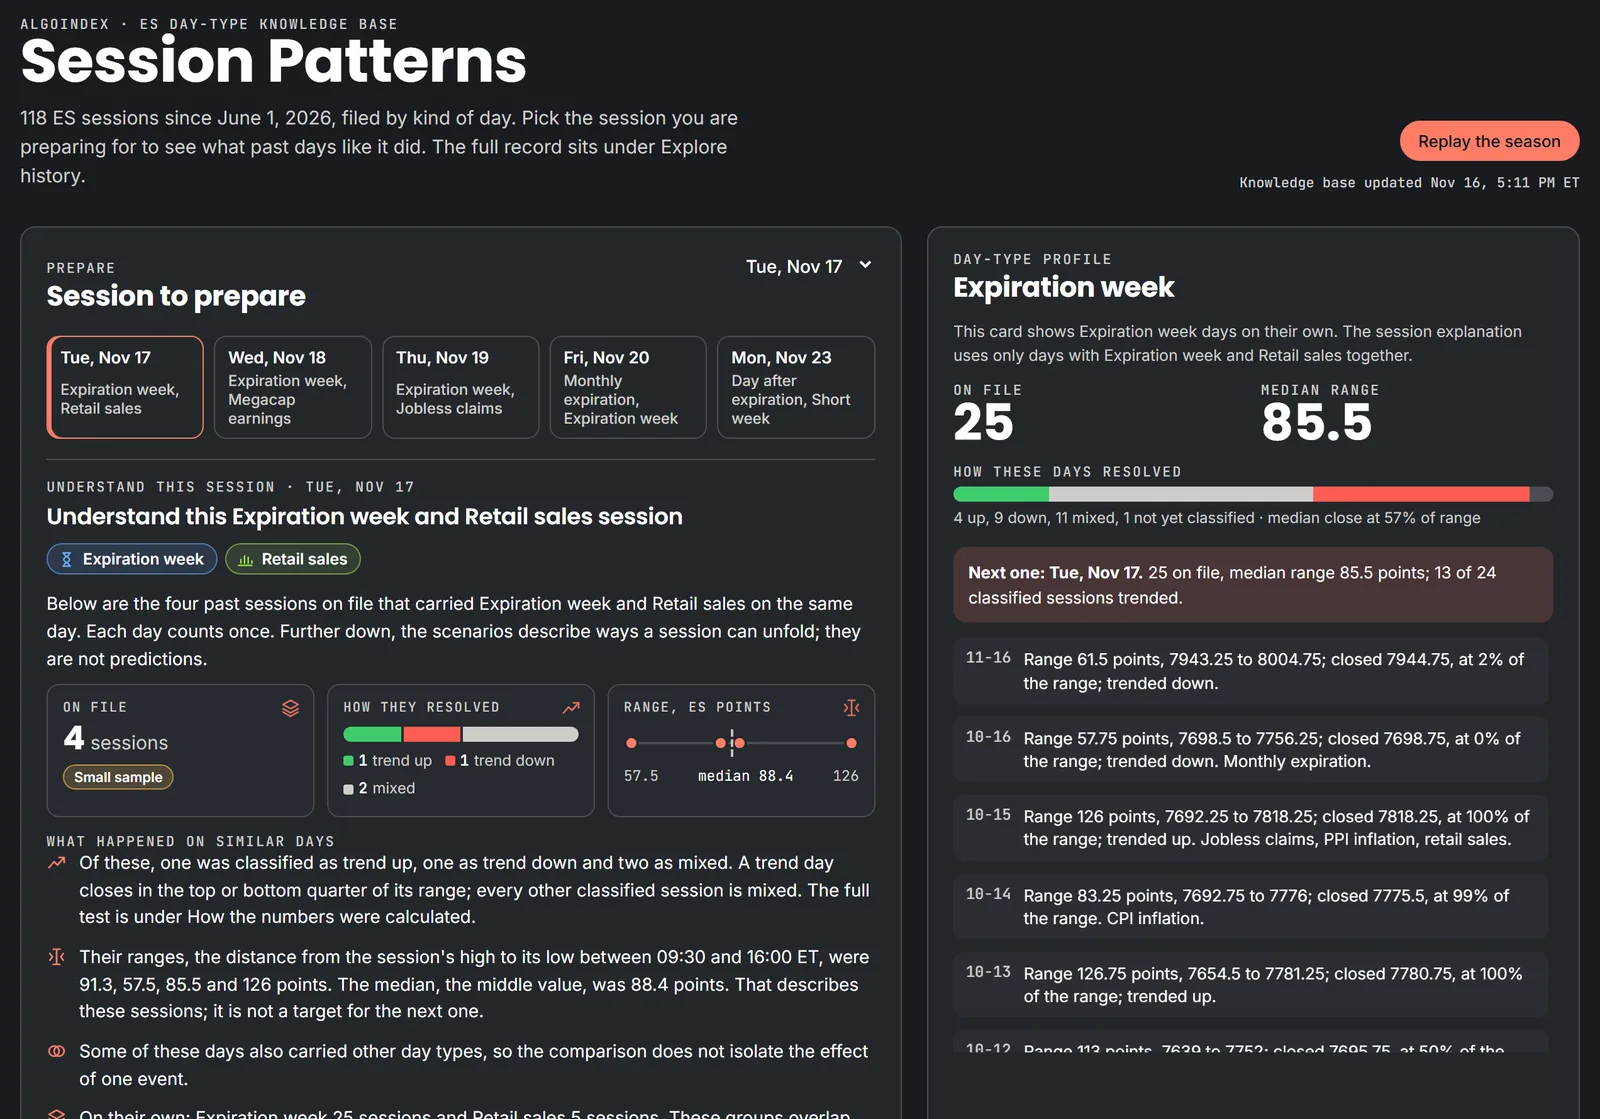
Evidence Table and Historical Overlay Chart
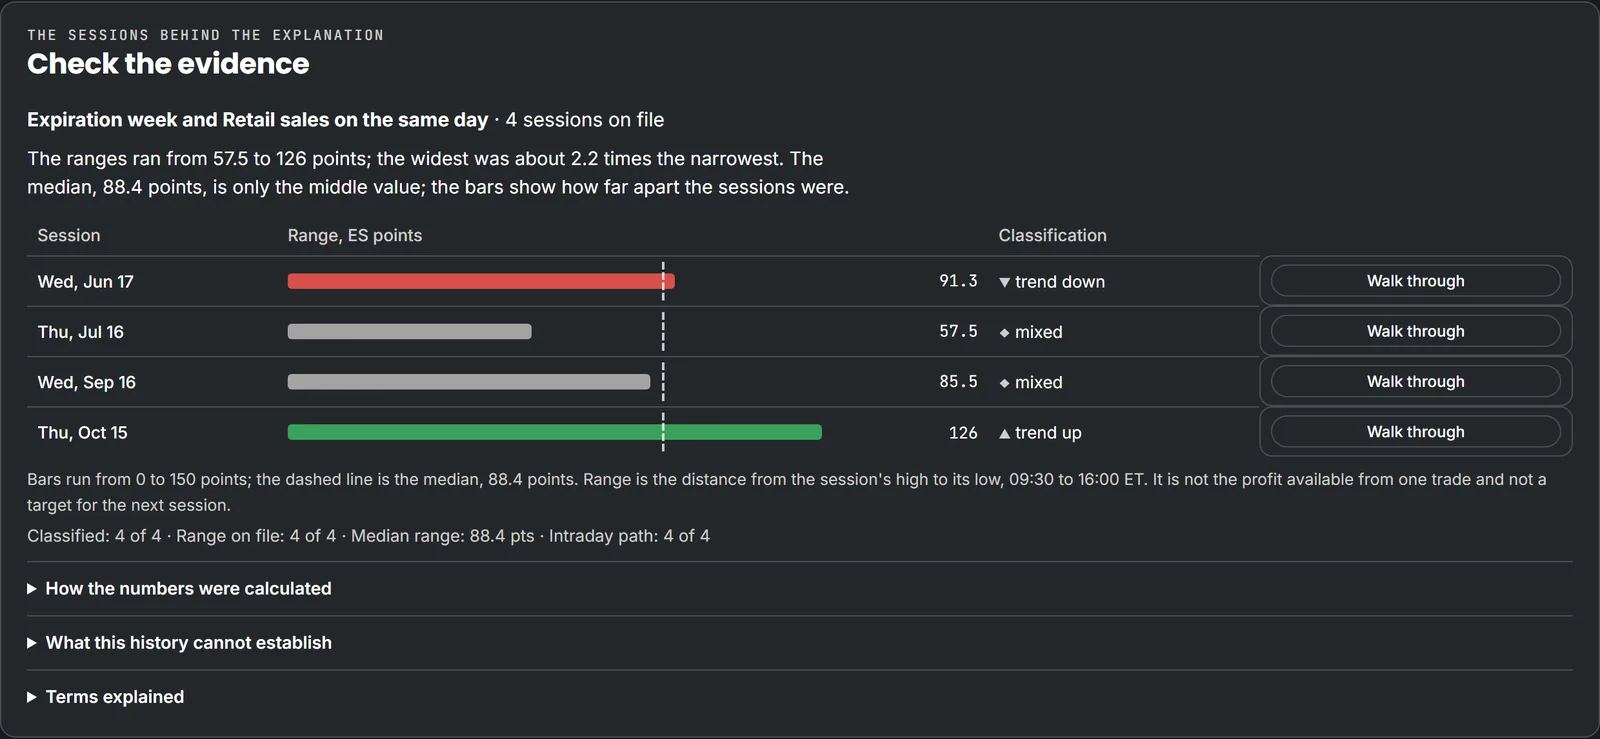
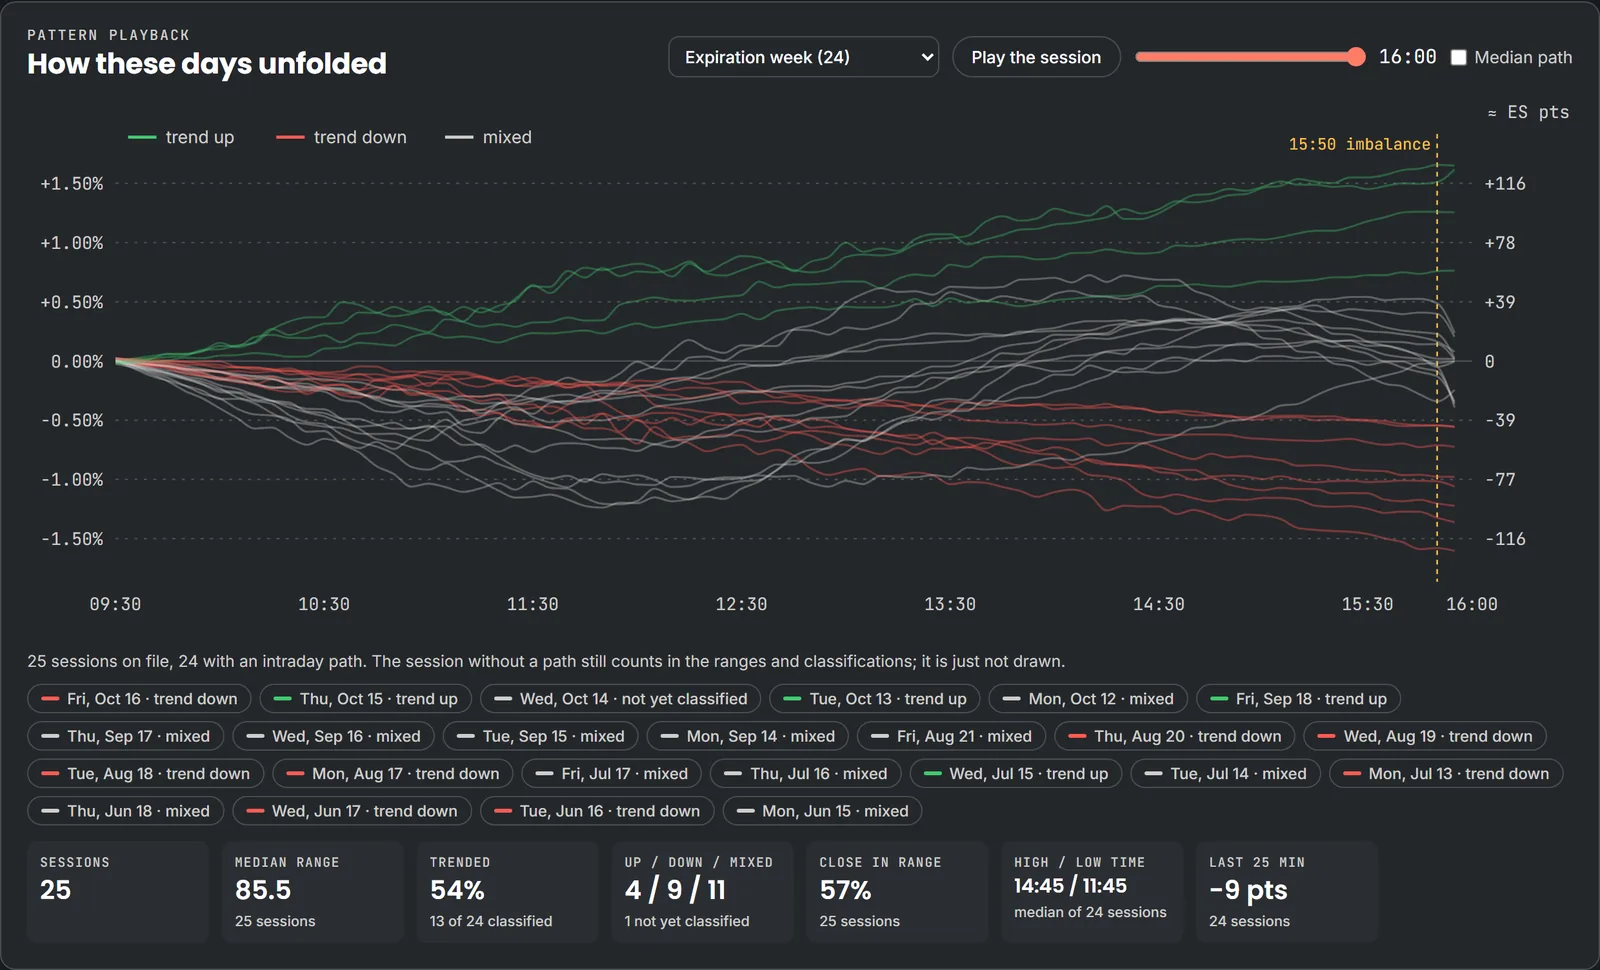
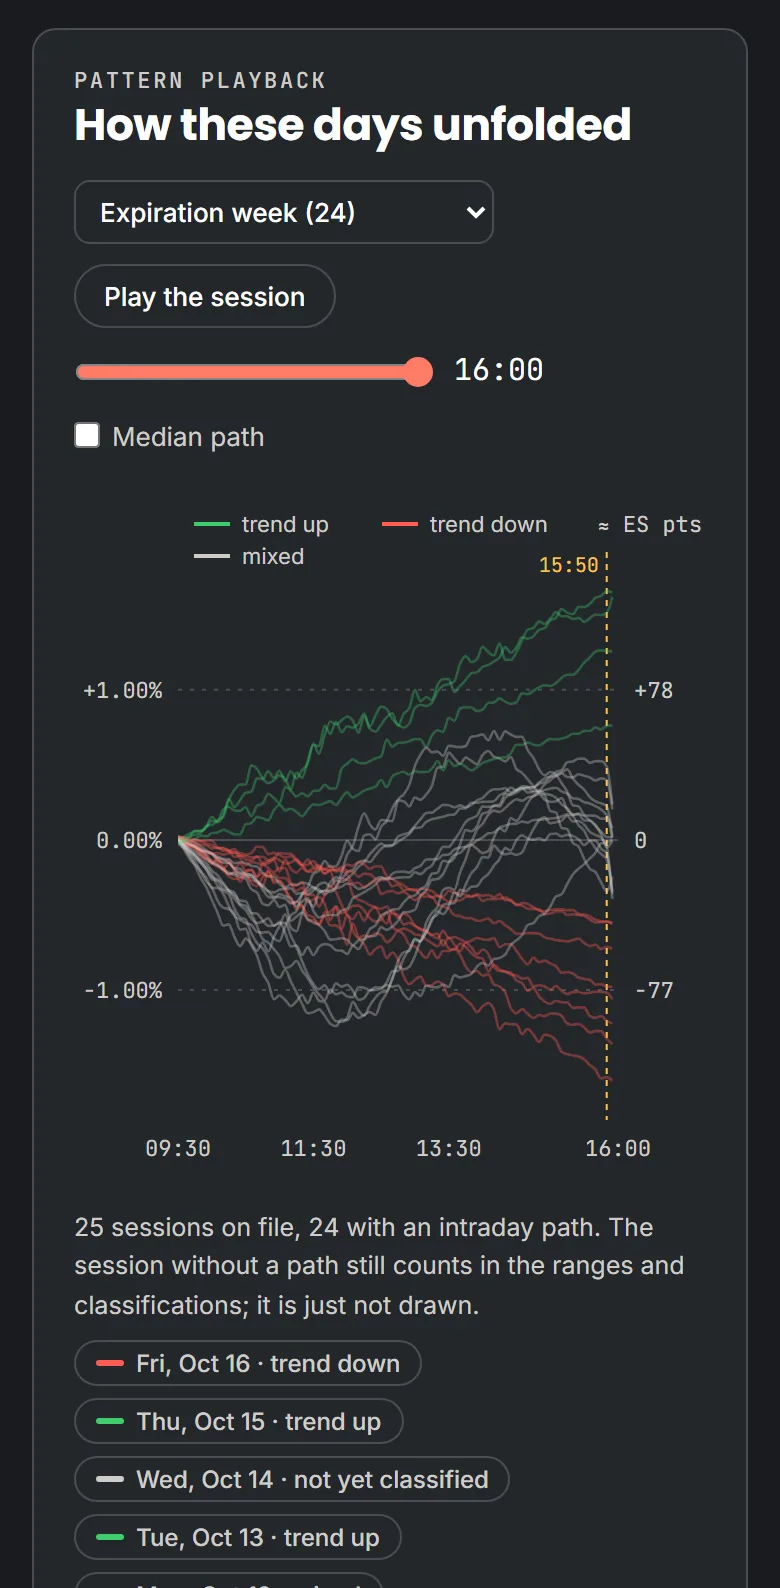
Every statement in the brief comes from the comparable sessions listed under it. Open the rows, compare their ranges, then compare the available paths from the open.
Scenario Guides
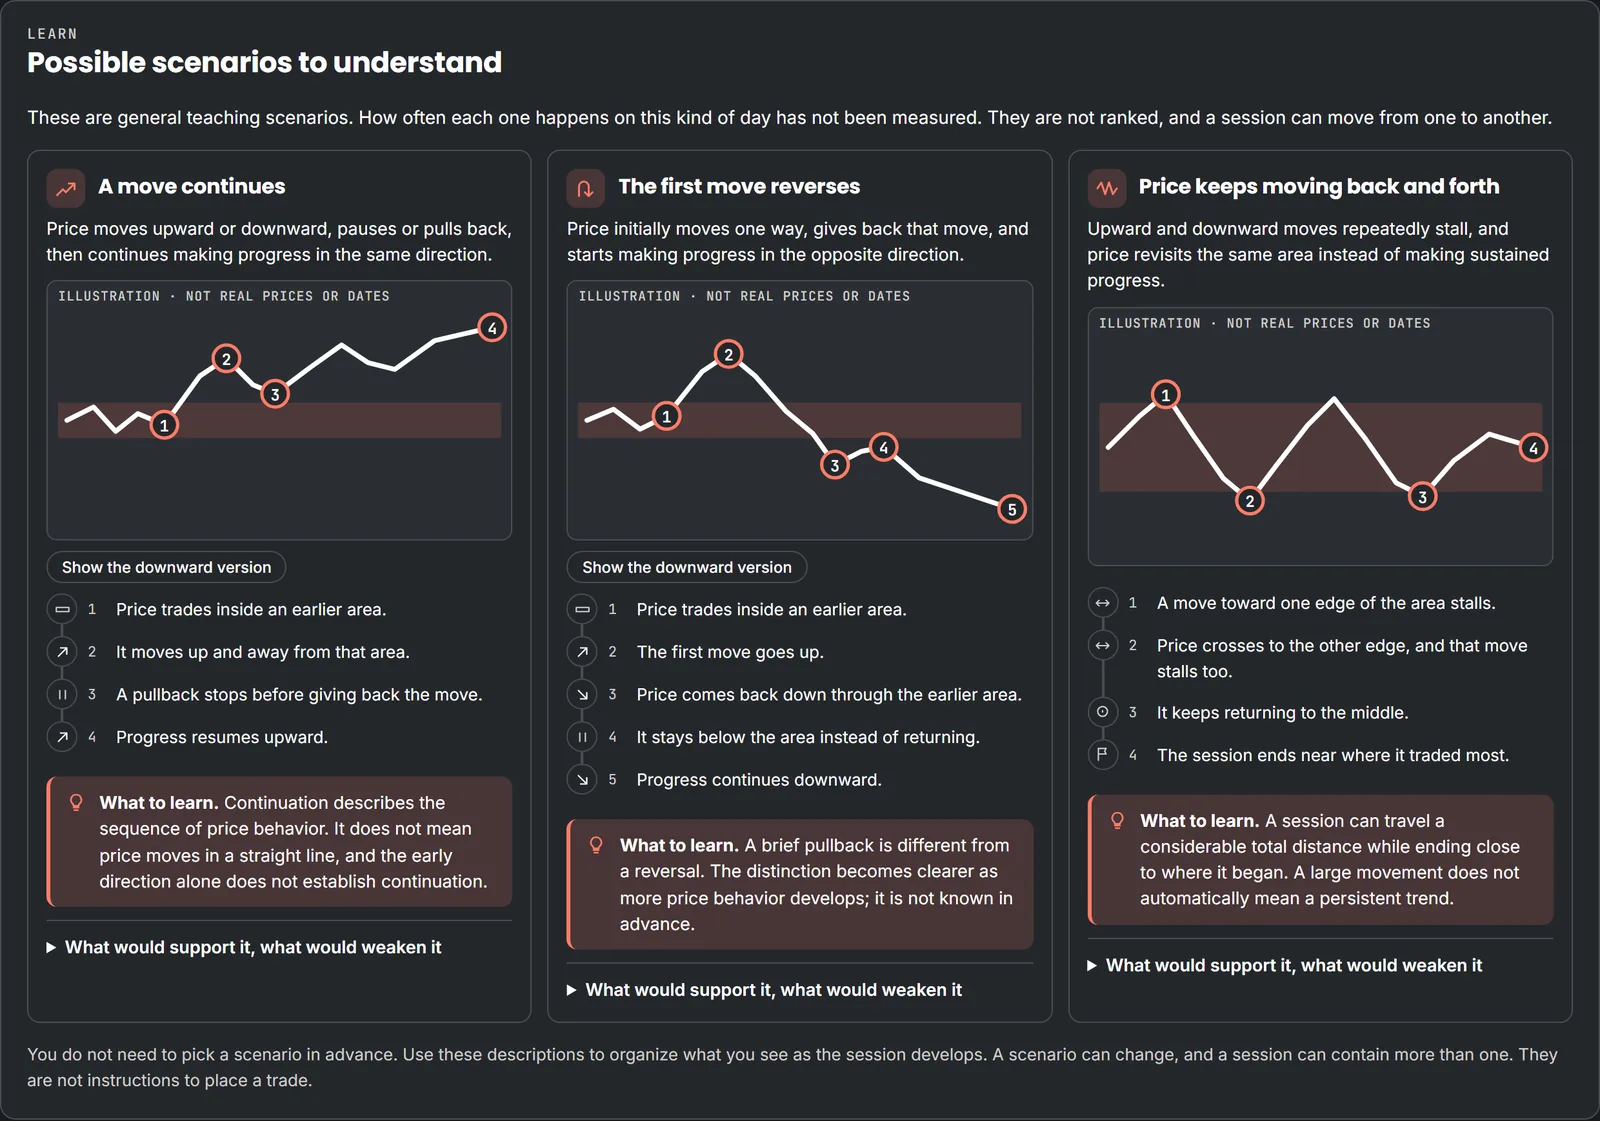
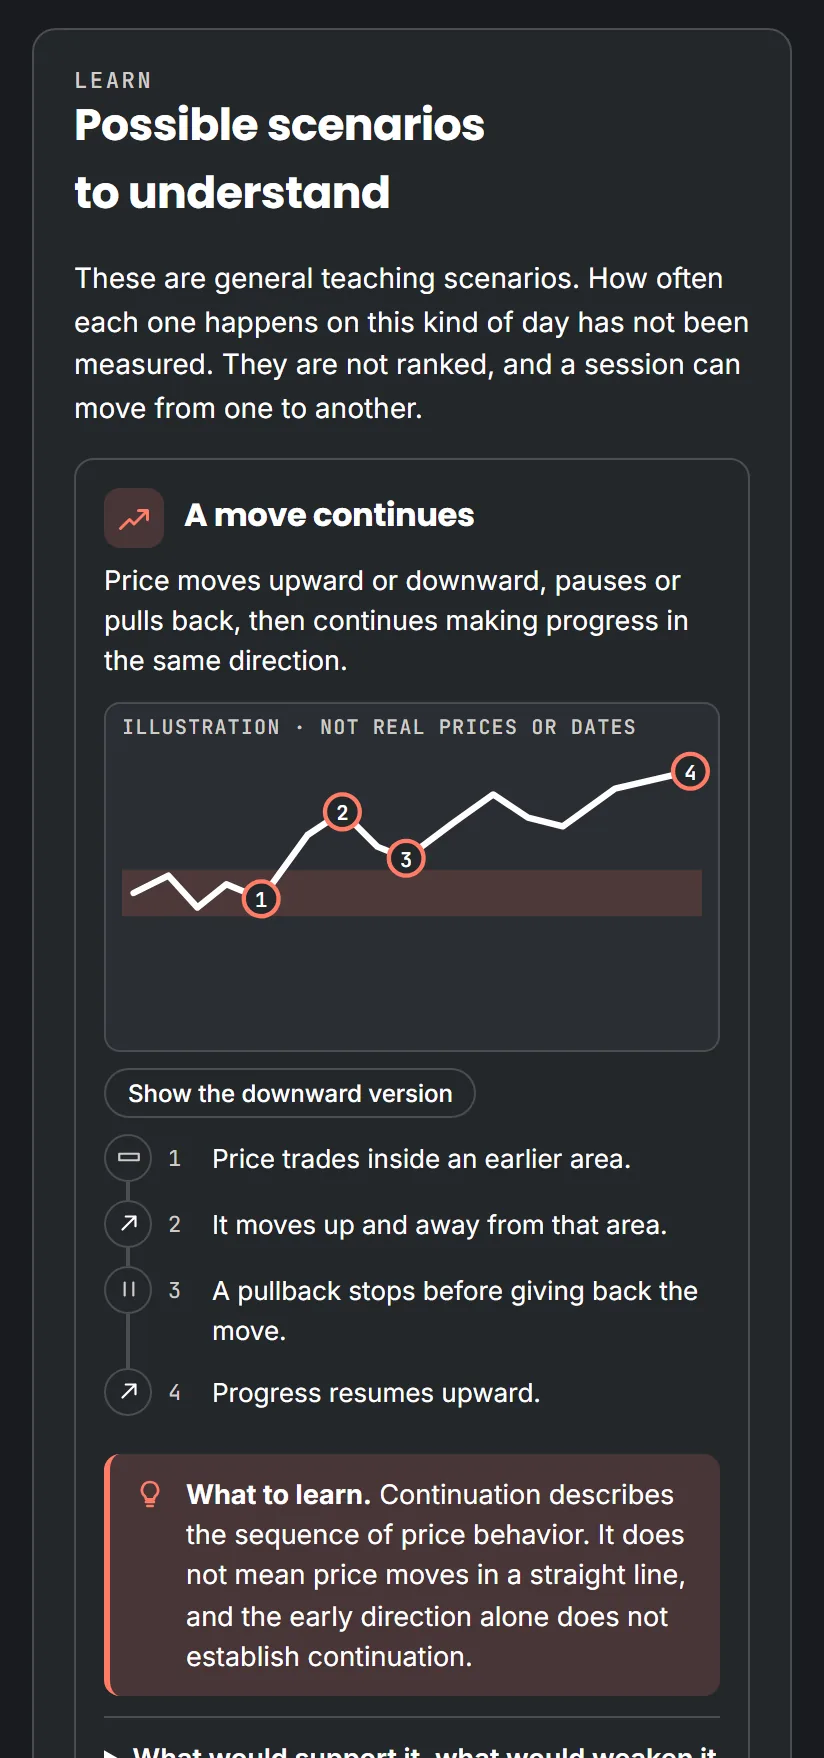
Three general teaching scenarios describe how a session can develop: a move that continues, a first move that reverses, and price that keeps moving back and forth. They are sketches to learn from, not ranked forecasts, and a session can move from one to another.
Step-by-Step Session Replay
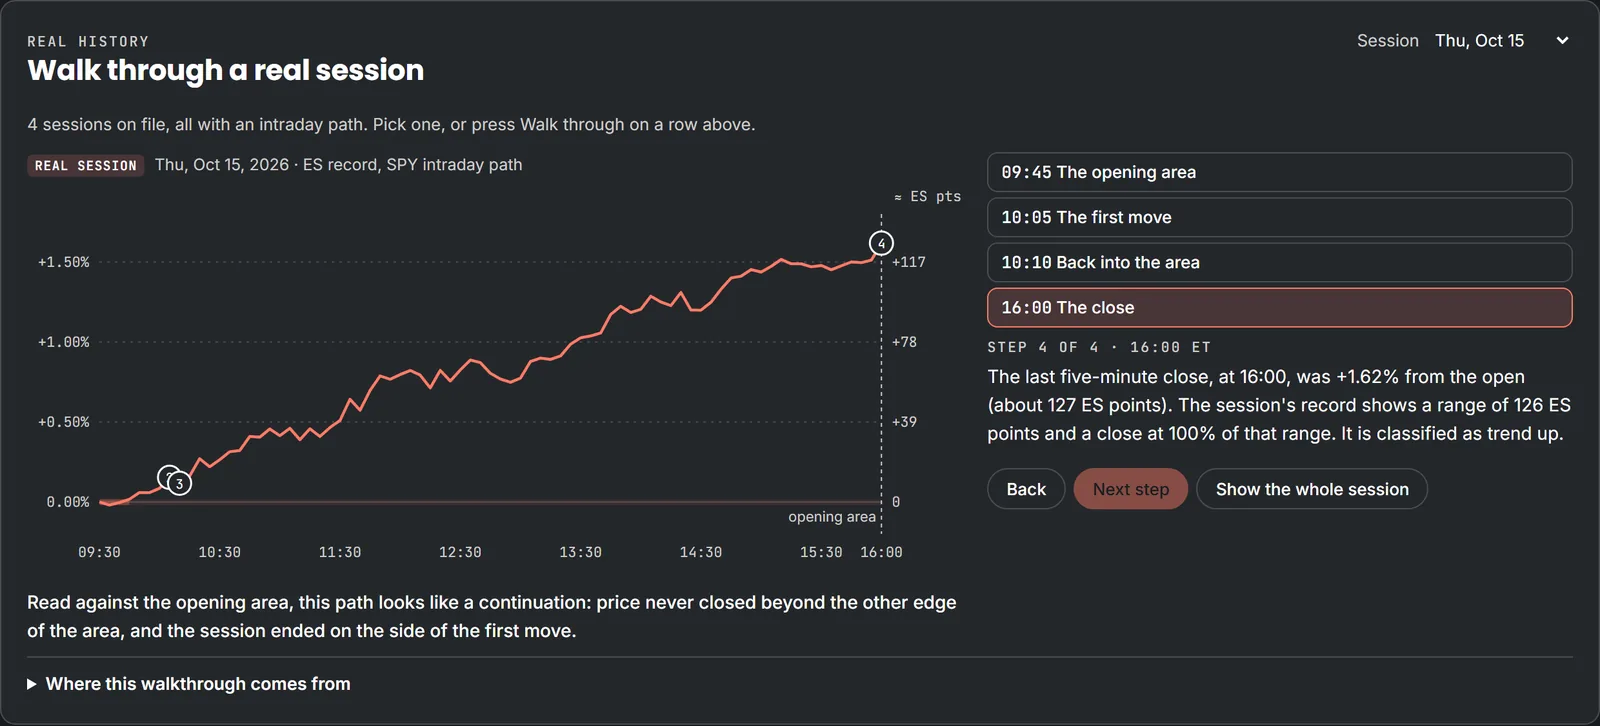
Pick one comparable session and step through its intraday path: the opening area, the first move, what price did next and how it closed. Replay it as many times as it takes for the shape to stick.
Similar-Day Finder
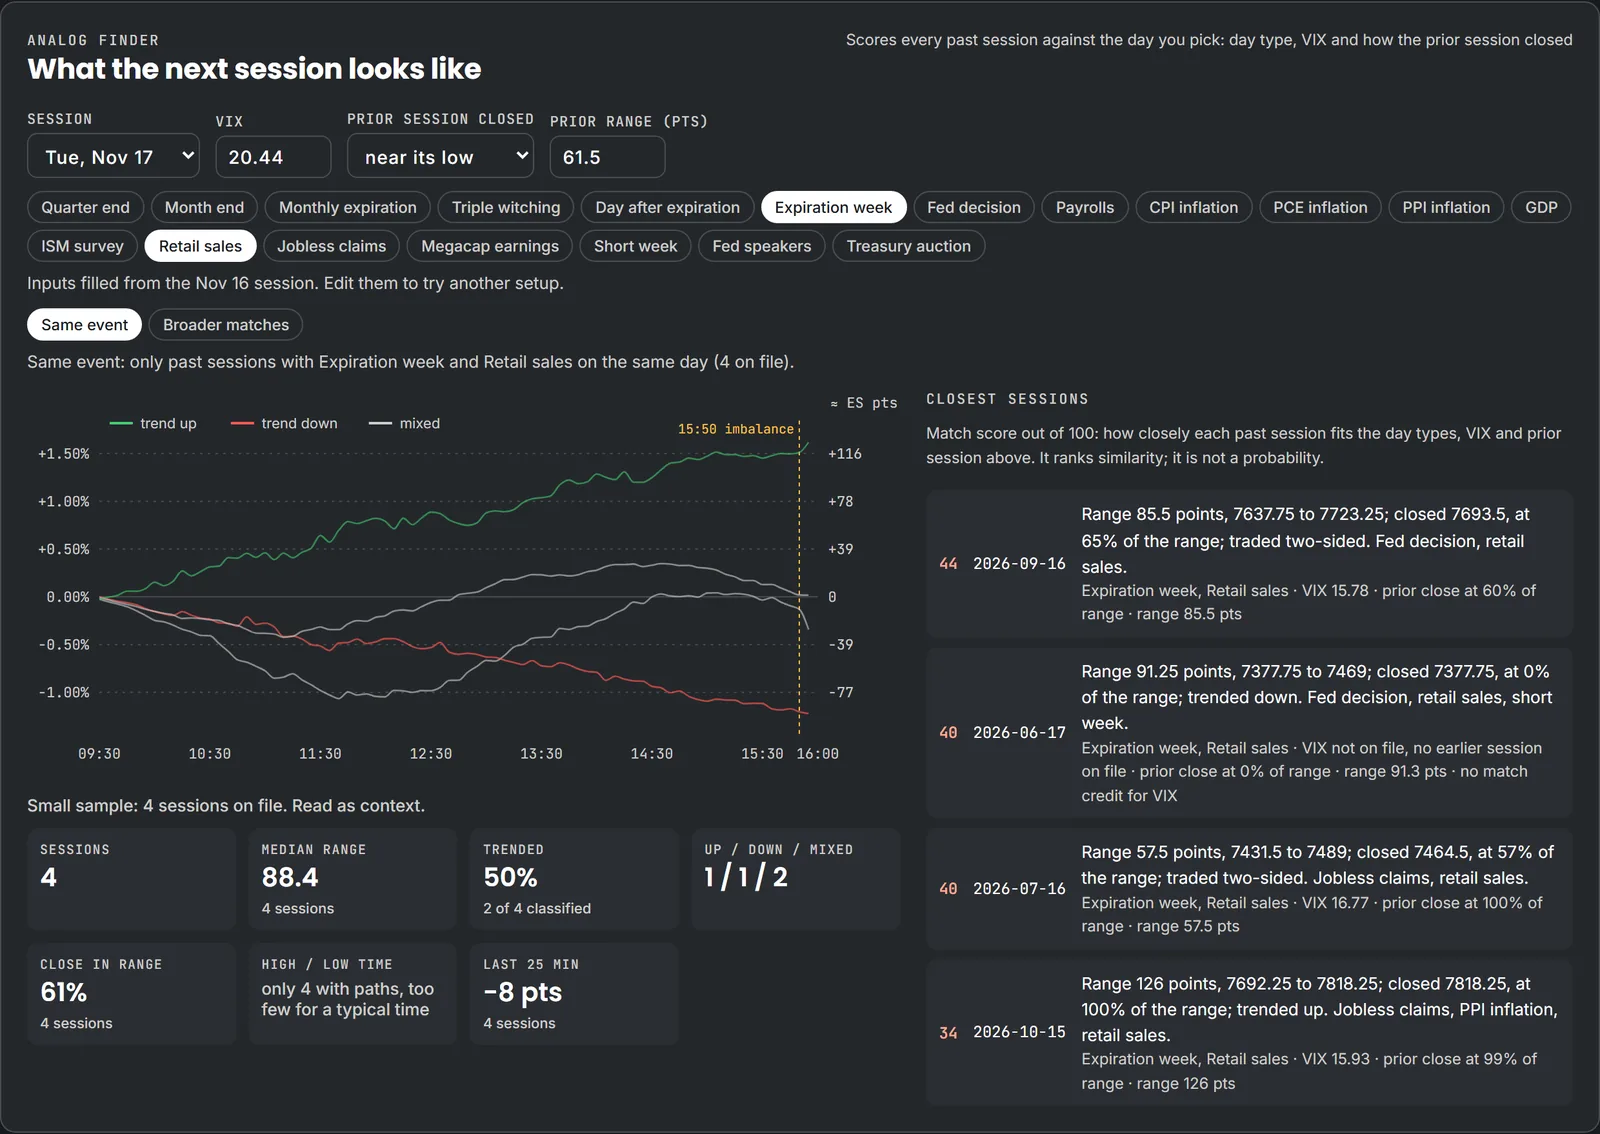
Describe a session by its day types, the volatility reading and how the prior session closed, and the analog finder ranks the past sessions that fit that description best. The match score ranks similarity; it is not a probability.
Explore history
One tap below the session to prepare sits everything on file: the calendar, the constellation of day types, the closing auction readings and the road ahead.
Every session on one calendar, shaded by how wide the day traveled and outlined by day type. Filter it to a single day type with one tap.
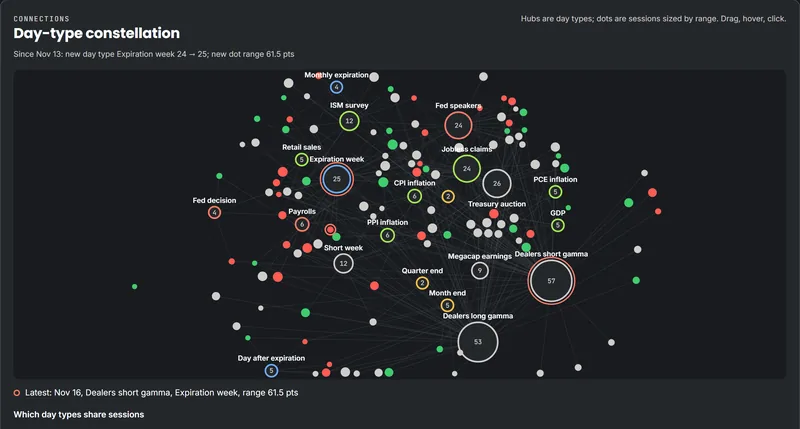
Each dot is a session. The picture shows session dots linked to the day-type hubs they carry, so days that share day types sit near each other.
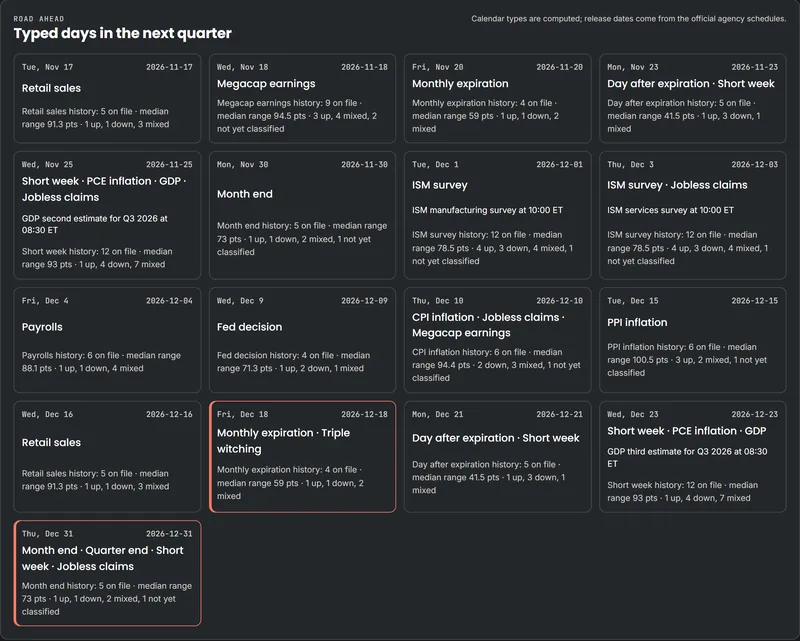
The sessions coming up that already carry a day type, so the dates worth preparing for are visible weeks in advance.
Each session is built from market data: the session's high, low, close and range, its intraday path where available, the volatility reading and the calendar of releases and expirations. The knowledge base refreshes after each session closes. When the release calendar is not on file, the page says so instead of hiding it.
Session Patterns is a study tool. It shows how past sessions behaved; it does not predict the next one, and it is not a trade signal or advice. Similar days can and do end differently.
A members study tool for ES. It files every past session by its day types and its shape, opens on the next session worth preparing for, and shows how comparable sessions behaved.
A label from the release and expiration calendar, such as payrolls, inflation data, a Fed decision, an expiration or month end. A session can carry several day types at once.
No. It shows how past sessions behaved. Similar days can and do end differently, and it is not a trade signal or advice.
When only a few past sessions carry the same day types, the page says so next to the brief, so you read those sessions as context and not as a rule.
Yes. Session Patterns is in the members dashboard and in the AlgoIndex app, with the same brief, evidence, scenarios and walk-through.
Session Patterns comes with Atlas, AlgoDesk and the three daily market briefings, on the web and in the AlgoIndex app.
Screens and illustrations on this page use sample data, not real sessions. Past market behavior is not a guarantee or reliable indicator of future results. Trading futures and options involves substantial risk. Nothing here is investment advice.