
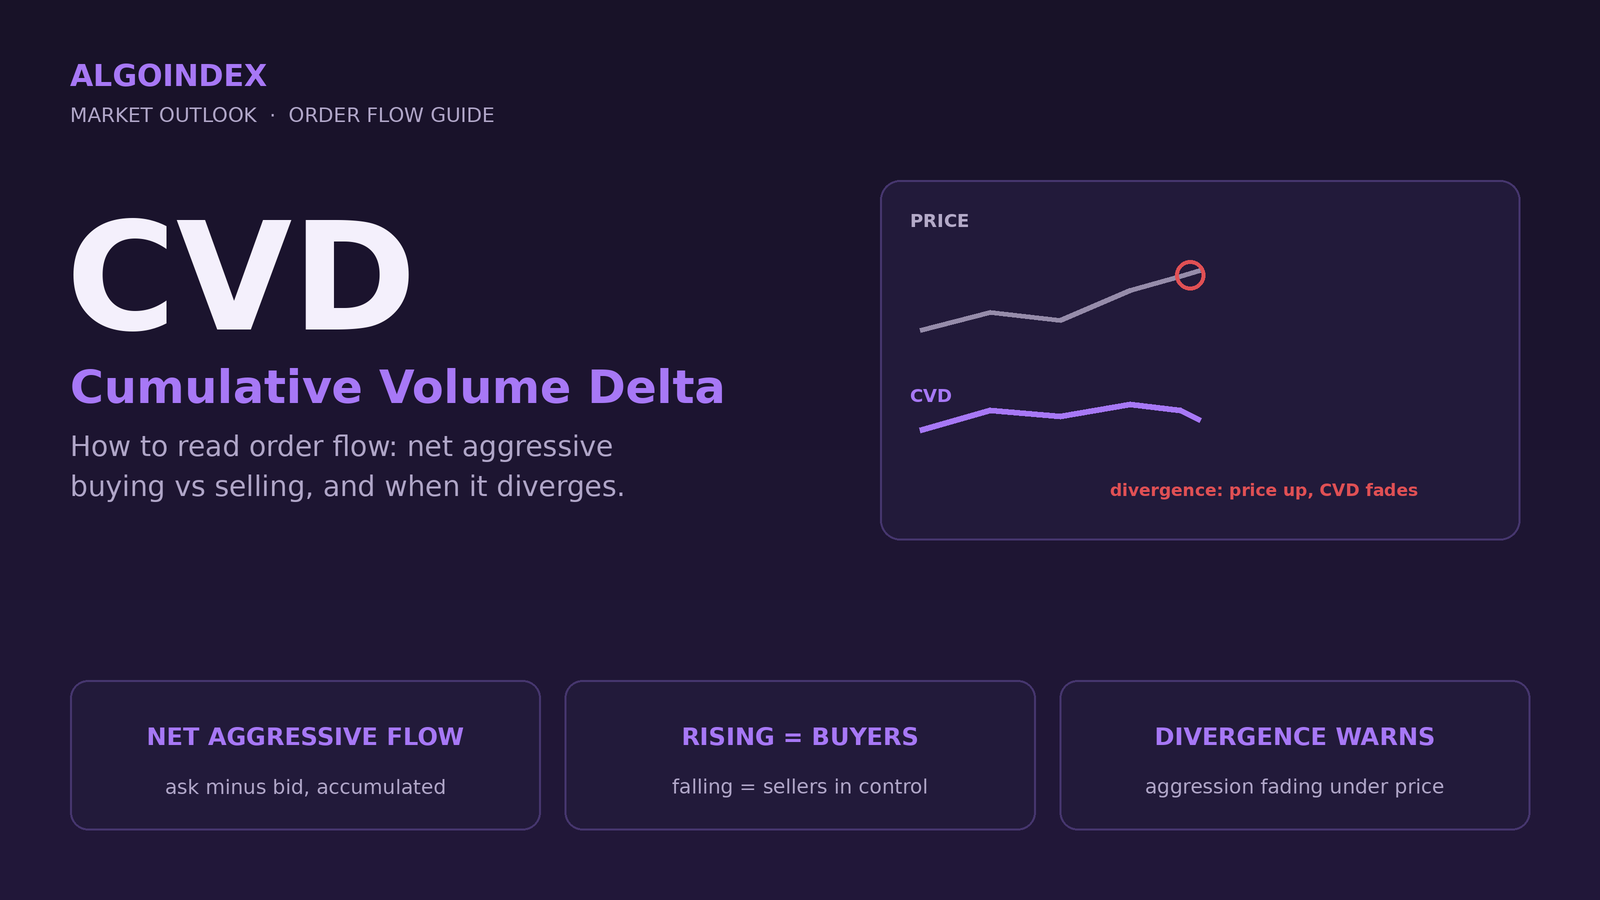
Cumulative Volume Delta, or CVD, is a running total of net aggressive order flow. Every trade is either a buyer reaching up to hit the ask or a seller pressing down to hit the bid. The difference between those two, per bar, is the volume delta; add those deltas up continuously and you get the CVD line. When it rises, aggressive buyers are in control. When it falls, aggressive sellers are. It answers a question price alone cannot: not where the market went, but who had to be aggressive to move it.
Picture a quiet afternoon where the index grinds to a fresh high. On the chart it looks strong. But the CVD line, instead of pushing to its own new high, quietly rolls over. That gap is a warning: price is climbing while the net aggressive buying that should be powering it is fading. Someone is selling into the strength. More often than not, that divergence shows up before price turns, which is exactly why order-flow traders watch CVD rather than price alone.
CVD earns its keep in two moments: when it confirms a move and when it contradicts one. But it comes with a catch most guides skip, which is that a CVD line is only as honest as the data feeding it. Get the data right and read it against the levels that matter, and it becomes one of the sharpest reads on the screen.
Volume delta, the building block
Volume delta is the difference between aggressive buying and aggressive selling in a single period. Aggressive buyers are the ones who cross the spread to buy at the ask; aggressive sellers hit the bid. If a one-minute bar trades 1,000 contracts at the ask and 700 at the bid, its delta is plus 300, a net of aggressive buying. A bar with more selling prints a negative delta. Delta measures conviction: it separates the traders who demanded immediate execution from the passive orders sitting and waiting.
How CVD is calculated
CVD is simply volume delta, accumulated. Take each bar's delta and keep a running sum: the CVD at any point equals the previous CVD plus the current bar's delta. One bar of plus 300 followed by a bar of minus 100 leaves CVD at plus 200. The single bar tells you the last minute; the cumulative line tells you the balance of aggression over the whole session, which is what makes the trend of the line, not any one reading, the thing to watch.
How to read it: confirmation, divergence, absorption
Three patterns do most of the work. Confirmation is the healthy case: price and CVD move together, higher highs in price matched by higher highs in the line, which says the trend has genuine aggression behind it. Divergence is the warning: price makes a new extreme but CVD does not, meaning the move is running on fumes rather than fresh buying or selling, and a reversal becomes more likely. Absorption is the most telling: CVD surges hard in one direction while price barely moves, which means a large passive order is quietly soaking up every aggressive trade thrown at it without giving ground, often marking a level where the move is about to stall or turn.
Where CVD gets its edge: read it at the levels that matter
On its own, CVD tells you who is being aggressive. It does not tell you where that aggression is likely to matter. That is why, at AlgoIndex, we do not read CVD in isolation, we read it against the dealer-positioning map. CVD answers who; the call and put walls and dealer gamma positioning answer where. Put the two together and the reads sharpen. A CVD divergence as price presses into a call wall is a far higher-conviction fade than the same divergence in open space. Aggressive selling that finally breaks a put wall, confirmed by CVD pushing to a new low, is a real breakdown rather than a shakeout. And CVD absorption sitting right on a wall is often the footprint of the dealer flow defending that level. Order flow and positioning are two halves of the same picture; most guides only show you one.
CVD also pairs naturally with the broader market internals. When breadth, the volume-difference reads, and CVD all lean the same way, the aggression is broad; when they split, the move is narrow and suspect.
The catch nobody mentions: the data
CVD is only as good as the classification of each trade into buy or sell, and that is where most retail versions quietly fall short. True delta requires tick-by-tick data that records whether each trade hit the bid or the ask. Professional exchange feeds provide exactly that. Most retail platforms do not, so they reconstruct the buy-or-sell label from lower-timeframe price behavior using what is known as the tick rule, an approximation that is right roughly 75 to 80 percent of the time. That is good enough to see the big divergences, but it means two CVD lines on the same market can disagree, and a line built on approximated data should be trusted less at the margin. Our ES reads use real bid and ask delta rather than a reconstruction, which is the difference between measuring the flow and estimating it.
One more honest caveat: a divergence is a probability, not a trigger. In a powerful trend, price can keep climbing while CVD diverges for a long time before anything gives. CVD sharpens timing and conviction; it does not replace a plan or a stop.
Price tells you the market moved. Cumulative Volume Delta tells you who had to be aggressive to move it, and whether they are still there. Read that against the levels where positioning is concentrated, on data you can trust, and you are looking at the market the way the flow actually works.
Frequently Asked Questions
Cumulative Volume Delta (CVD) is a running total of net aggressive order flow, the difference between volume executed at the ask (aggressive buying) and volume executed at the bid (aggressive selling), summed continuously over time. A rising CVD means buyers are the aggressors; a falling CVD means sellers are.
How is CVD calculated?Each bar has a volume delta: volume at the ask minus volume at the bid. CVD is the running sum of those deltas, so the current CVD equals the previous CVD plus the current bar's delta. The slope and the highs and lows of the resulting line are what traders read, not any single value.
What is a CVD divergence?A CVD divergence is when price makes a new high or low but CVD fails to confirm it, signaling that the aggression behind the move is fading. It often precedes a reversal, though in a strong trend a divergence can persist for a while before price turns, so it is a warning, not an automatic trigger.
Is CVD accurate, and where does the data come from?CVD is only as accurate as the trade data behind it. True delta needs tick-by-tick data showing whether each trade hit the bid or the ask, available from professional exchange feeds. Many retail platforms instead approximate it with the tick rule, correct roughly 75 to 80 percent of the time, so CVD lines can differ between sources. It is reliable for spotting large divergences and best trusted when built on real bid and ask data.
How do you use CVD in trading?Use it to confirm moves (price and CVD rising together), to flag reversals (divergence), and to spot absorption (CVD surging while price stalls). It is sharpest when read at meaningful levels, such as call and put walls, rather than in isolation. Combine it with a plan and risk control; trade only risk capital.
Read the flow at the levels that matter.
AlgoIndex reads real ES order flow against the dealer-positioning map every session. See how the levels are tracked in the gamma level accuracy tracker and the performance statement, then view pricing.
Related: market internals, call and put walls, and dealer gamma positioning, and value area and VPOC.
If you want to see whether these order-flow readings actually helped your own trades, log them in the free AI trading journal and let the coach grade each one. No card required.



