
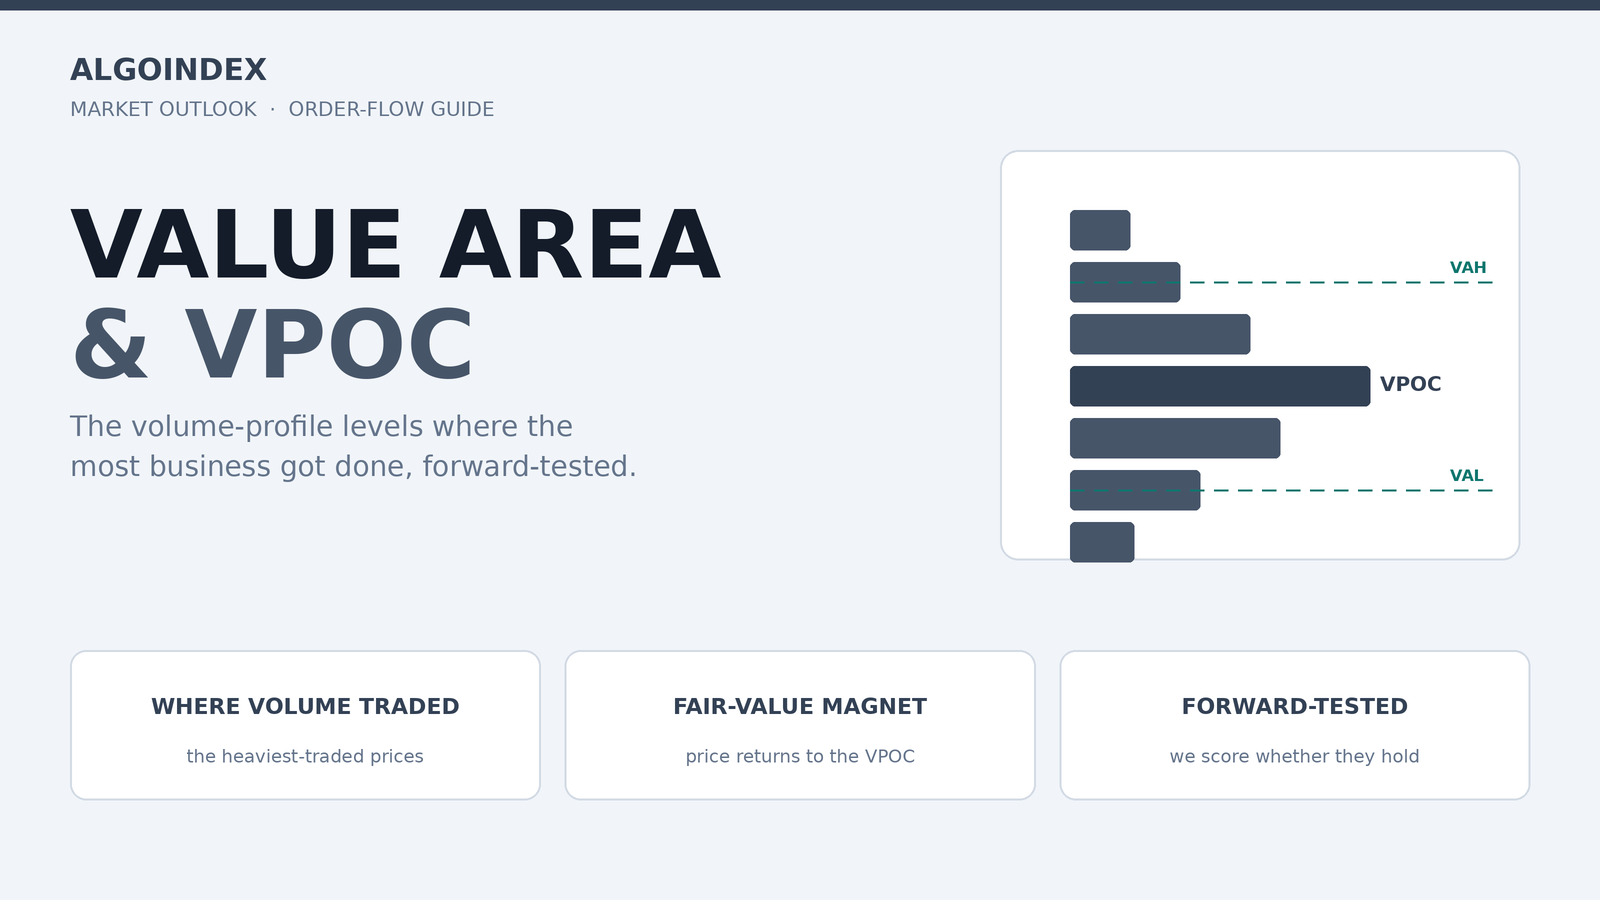
Most charts show where price went. A volume profile shows something more useful: where the trading actually happened. Turn the volume sideways and stack it by price, and you can see the levels the market cared about most. The single price with the heaviest volume is the point of control, or VPOC, the session's center of gravity. The band around it that contains the bulk of the volume, usually about seventy percent, is the value area, bounded by the value-area high (VAH) and value-area low (VAL). These are the prices where buyers and sellers agreed on value, and they tend to act as support and resistance long after the session that formed them.
Watch a market long enough and you will see price drift back toward the VPOC again and again, as if pulled. It makes sense: the price where the most business got done is the price the most participants consider fair, so when the market wanders away and no new information justifies it, it tends to come back. The open question, the one that separates a useful level from a line on a chart, is whether these levels actually hold when price reaches them. That is testable, and we test it.
We score every one of these levels forward, the moment the session closes, and publish the running result in our accuracy tracker. In the current sample the value-area high has held about four times in five when tested, the VPOC about two in three, and the value-area low closer to three in five. Useful, not infallible, and worth knowing the odds before you lean on one.
VPOC: the fair-value magnet
The point of control is the single price with the most traded volume in the period you are profiling, whether that is a day, a week, or a longer stretch. Because it marks where the most agreement happened, it behaves like a magnet: price that has drifted away on thin volume often gravitates back to it, which makes the VPOC one of the cleaner mean-reversion targets on the chart. A VPOC that stays fixed day after day marks a well-accepted level; a VPOC that migrates steadily higher or lower is a sign the market is repricing and building value in a new area.
The value area: where the market agreed
The value area is the range around the VPOC that contains roughly seventy percent of the volume, a common convention borrowed from the standard deviation of a normal distribution. Its edges, the VAH and VAL, act as the boundaries of accepted value. Inside the value area, price tends to rotate and mean-revert. At the edges, one of two things happens: the level rejects price back inside, which is the range-bound case, or price breaks and holds outside, which says the market is accepting a new range and often precedes a trend. Knowing which edge you are testing, and how often that edge has held, is most of the read.
Do these levels actually hold? The forward-tested answer
This is where we part ways with the tools that draw the profile and stop. Drawing the value area is the easy half; scoring whether price respected it is the half that tells you if it is worth anything. Here is what the current forward-tested sample shows for the S&P 500 complex.
Two things stand out. First, these are strong tendencies, not guarantees: the value-area high holding roughly four times in five is genuinely useful, but the one time in five it fails is why you always trade it with a stop. Second, the asymmetry. The upper edge holds more reliably than the lower edge, the same pattern we see with the call and put walls: support levels break more easily than resistance levels, because fear moves faster than greed. That is a tradable insight on its own.
How to use the value area
Three uses cover most situations. As a mean-reversion target: on a quiet, range-bound day, fading a move back toward the VPOC is a high-probability play, taking profit near the center of the profile. As range boundaries: treat the VAH and VAL as the edges of the day's likely rotation, fading tests of them when the broader read is range-bound. As a breakout signal: a decisive close outside the value area that holds is acceptance of a new range, which often precedes continuation rather than reversal, so a value-area breakout is information, not a level to fade blindly. The confirmation that separates a real break from a fake one is order flow, which is why we read these levels alongside cumulative volume delta: a VAH that holds while CVD stalls is a clean fade, and a break backed by a CVD surge is the real thing.
One relative worth naming: VWAP, the volume-weighted average price, is the intraday cousin of the VPOC. Where the VPOC is the single most-traded price over a chosen period, VWAP is a running average that updates tick by tick through the session. Both are volume-based fair-value references, and both work as pullback and mean-reversion levels; the VPOC is the anchored version, VWAP the moving one.
A volume profile turns a chart from a record of where price went into a map of where value was built. The VPOC is the center of that map, the value area its accepted range, and the forward-tested hold rates tell you how much to trust each edge. Trade the levels that earn it.
Frequently Asked Questions
The value area is the price range that contains the bulk of a period's volume, usually about seventy percent, centered on the point of control. Its boundaries are the value-area high (VAH) and value-area low (VAL). It marks the range of prices where buyers and sellers agreed on value, and its edges tend to act as support and resistance.
What is VPOC or the point of control?The point of control (VPOC) is the single price with the most traded volume in the period being profiled. Because it marks where the most agreement happened, it behaves like a magnet that price tends to return to, which makes it a common mean-reversion target.
What is the difference between VWAP and VPOC?Both are volume-based fair-value references. VPOC is the single most-traded price over a chosen period, an anchored level. VWAP, the volume-weighted average price, is a running average that updates through the session. VPOC is the fixed center of the profile; VWAP is the moving one.
Do value-area levels actually work?They work as strong tendencies. In our forward-tested sample, the value-area high has held about four in five times when tested, the VPOC about two in three, and the value-area low closer to three in five. They should be traded as probabilities with a stop, not as guarantees; see the live figures in our gamma level accuracy tracker.
How do you trade the value area?Three ways: fade moves back toward the VPOC as a mean-reversion target on quiet days; treat the VAH and VAL as range boundaries to fade when the market is range-bound; and treat a decisive close outside the value area that holds as a breakout signal. Confirm holds and breaks with order flow, and always use a stop. Trade only risk capital.
Trade the levels that actually hold.
AlgoIndex marks the value-area and gamma levels each session and scores whether they held. See the live numbers in the gamma level accuracy tracker and the performance statement, then view pricing.
Related: cumulative volume delta (CVD), call and put walls, and SPX support and resistance levels.



