
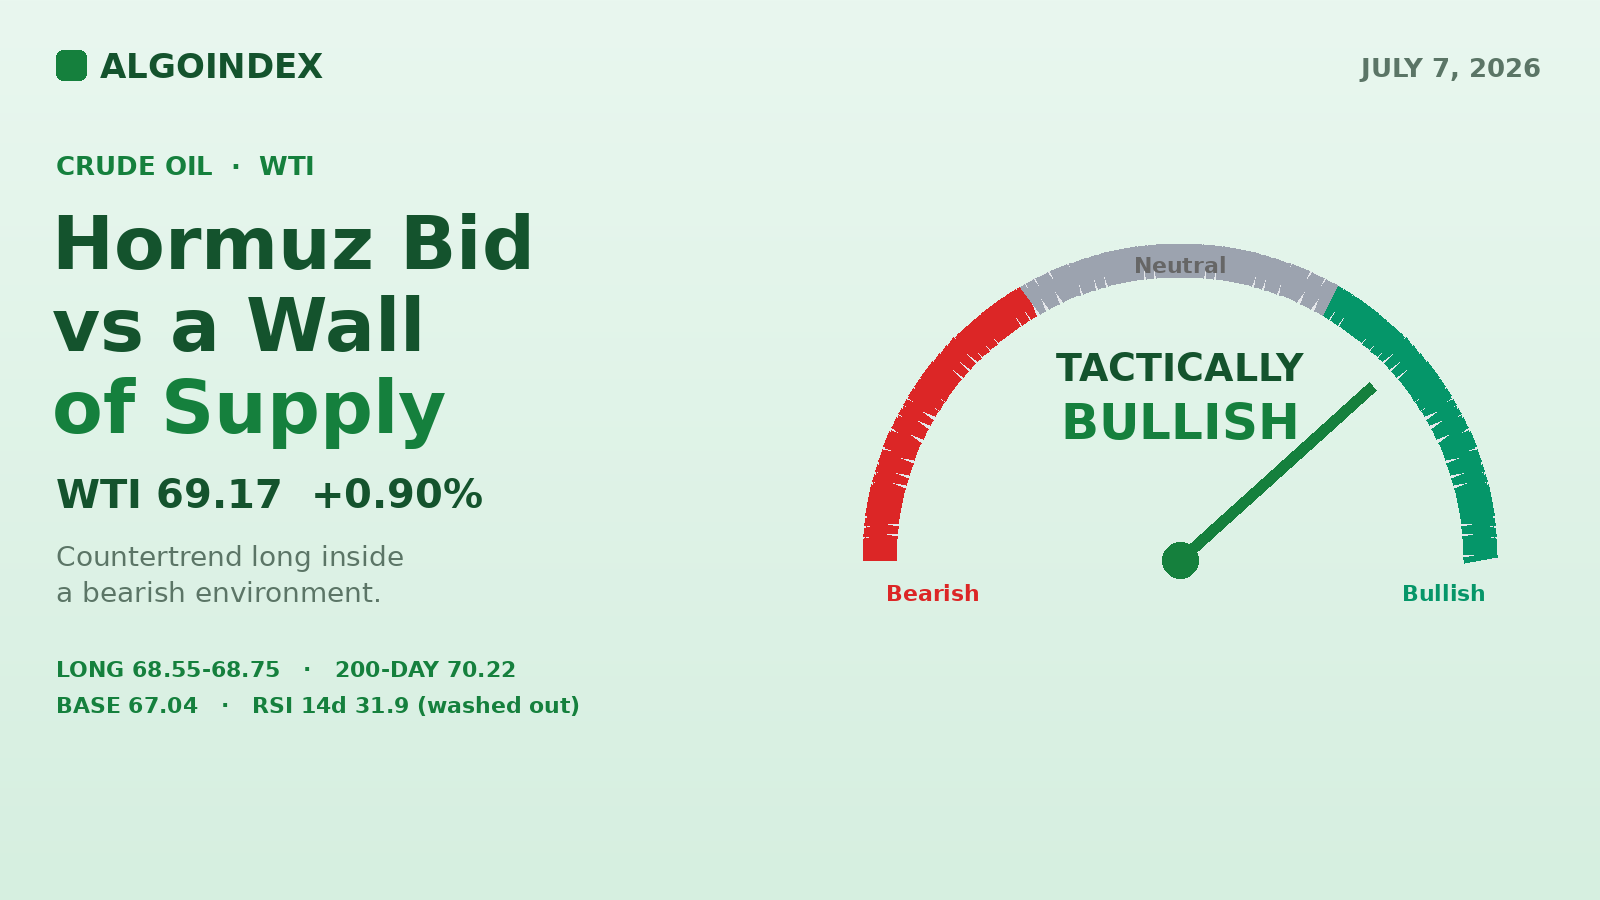
WTI is up 0.90 percent near 69.17 after an overnight run to 69.74 on renewed Strait of Hormuz attacks. Underneath the bid, the supply picture is heavy: the producer group raised output Sunday and Saudi Arabia cut its flagship price to Asia by 11 dollars. That is the tension, an entrenched downtrend with washed-out oscillators (RSI near 32) meeting a live geopolitical catalyst and a four-year-high crack spread pulling crude through refineries. The tactical plan: buy the 68.55 to 68.75 pivot confluence toward 69.27, 69.74, and 69.98. Bias tactically bullish for the day, moderate conviction, within a larger bearish environment.
A laden tanker took a projectile near the Omani coast, Iran fired at least four one-way attack drones at vessels, the UAE pushed missile-threat alerts to phones, and crude did what crude does on a Hormuz headline: it ran, from a 68.58 open to a 69.74 high before the US day session even began. That 1.16-point overnight range is roughly 40 percent of a normal day's travel, spent before the opening bell.
The bid is real but conditional. In yesterday's note we flagged the 67-handle base and the 200-day as the ceiling of crude's range; four consecutive higher lows later, the market is testing the top of that box. What makes today tradeable is the contradiction underneath it. The producer group raised its output target on Sunday, Saudi Arabia slashed its flagship grade to Asian buyers by 11 dollars a barrel, far deeper than the 8 expected, and Hormuz flows have actually been increasing, with four million barrels of Saudi crude in transit through the strait right now. A bear trend losing its push, meeting a bounce catalyst.
The bid against the weight
- Hormuz attacks on shipping, drones at vessels, UAE alerts
- Crack spread at a four-year high, refiners buying crude
- Gasoline at a three-week high, product-led support
- Four consecutive higher lows off the 67.04 base
- Producer group raised its output target Sunday
- Saudi cut its flagship to Asia by 11 dollars (vs 8 expected)
- Hormuz flows increasing, 4M barrels in transit
- Every major moving average is falling
The market has been burned twice this summer paying for Hormuz risk that never closed the strait.
The overnight Globex session opened 68.58, printed its low there almost immediately, ran to 69.74 on the headlines, then pulled back to the 69.10 to 69.20 area, digesting the spike rather than rejecting it. Monday's RTH was a down day of 0.14 (0.20 percent) that closed 68.55 near the middle of its range, pressured by the output decision and the Saudi cut but supported late by refined-product strength. The key inflection carried forward: sellers could not force a retest of the 67.04 swing low despite two bearish supply headlines, the kind of failed continuation that often precedes a short-covering push.
The daily chart remains a primary downtrend from the June 8 continuation high at 92.73, a decline of more than 21 percent in one month. The July 2 low at 67.04 is both the one-month and thirteen-week low and the structural downside reference for the week. Since that print, the market has put in four consecutive higher lows, a basing sequence between roughly 67.5 and 68.6, and the overnight push to 69.74 is the first attempt to expand that base upward. Price is back above the 5-day average near 68.92 but far below the 20-day near 75.71, so this is a countertrend recovery inside a bear leg, not a trend change. On the intraday frames the character shifted since July 2: a change of character on July 5-6, a series of higher lows from 68.0, a break of structure above the 68.8 to 69.0 swing highs, and overnight acceptance above 69.0, with the prior day's high near 69.2 now first intraday support.
The moving-average stack on the adjusted continuation series reads 5-day 68.92, 20-day 75.71, 50-day 85.06, 100-day 81.03, 200-day 70.22, year-to-date 76.58. Spot at 69.17 sits above only the 5-day. The most important overhead reference is the 200-day at 70.22, barely a point above current trade and just beyond the third resistance projection at 70.71, making the 70.2 to 70.7 zone the decisive test for any extension. The full stack is inverted, the 5-day below the 20-day below the 100-day below the 50-day, the signature of a market that fell hard and fast; mean-reversion room is large, but every major average is falling.
A bear trend losing its push
The oscillators are the counterweight to the trend. The 14-day relative strength stands at 31.92, the 9-day at 29.89, both at or just above washed-out territory, with the 20-day at 35.47 and the 14-day raw stochastic at 16.93 percent. Trend-strength readings still describe a strong, established downtrend, the 9-day directional index at 45.09 and the 14-day at 31.34, with the down-line near 28 against roughly 11 to 12 on the up-side. The composite reads 64 percent sell overall, 80 percent short-term, 50 medium-term, 33 long-term, but signal strength is soft and the 3-day direction is at its weakest reading. Momentum is still down, but it is decelerating exactly where the oscillators are stretched, the standard setup for a countertrend rally window.
"Soft crude flat price against booming refining margins historically resolves either by crude catching up or margins normalizing. The supply headlines decide which."
Crude carries no listed-options gamma surface comparable to the index products, so positioning reads through the energy complex and term structure. The front stays in backwardation, flattened by the output increase but held from flipping by the August premium and prompt-product strength, and the product complex is the standout: the crack spread at a four-year high and gasoline at three-week highs are pulling crude demand forward through refinery runs. Commitments data as of June 30 shows managed money long 203,601 contracts (down 6,082 on the week) against 122,319 short (down 4,492), a net long near 81,000 trimmed on both sides into the decline, with producers adding meaningfully to shorts (up 20,394) consistent with hedging into the output increase and swap dealers heavily net short as usual. The speculative community is neither stretched long nor capitulated, which leaves room for short-covering on escalation headlines and equally for renewed liquidation if the strait stays open. A weighted-alpha reading of plus 5.24 against a five-day change of minus 2.11 percent captures the same tension, longer-term gains, near-term bleed. The August contract expires July 21, so front-month behavior is not yet expiry-distorted, but roll flows build late next week.
Supply, demand, and a dollar in the middle
Supply-side news is doing most of the damage. The producer group agreed Sunday to raise its output target, formalizing the market-share strategy that has weighed on prices all summer, and Saudi Arabia followed by cutting the official selling price of its flagship light grade to Asian customers by 11 dollars a barrel for next-month delivery, far deeper than the 8 expected, signaling an aggressive fight for buyers. Kazakhstan extended its fuel export ban to May 2027, a marginal offset. The weekly US inventory data, due Wednesday at 10:30 ET after last week's draw of 3.775 million barrels, is the next hard supply datapoint. The demand read is firmer than the price action suggests: the crack spread surged to a four-year high on Monday and gasoline printed a three-week high, an incentive structure that pushes refiners to buy more crude, and that margin strength is the main reason Monday recovered from its worst levels. Friday's payrolls print of 57,000 against 113,000 expected cuts both ways, softer growth trims consumption forecasts but feeds rate-cut expectations that weaken the dollar over time.
Geopolitics is today's first-order driver. Beyond the shipping attacks and drone strikes, explosions were reported in Damascus, a major European energy company signaled a second-quarter trading windfall attributed directly to the conflict, and a central bank speaker flagged that governance of the waterway remains uncertain, even as Saudi Arabia holds preliminary talks about moving crude outside the strait entirely. The dollar index sits near 100.98, up 0.12 percent, a mild headwind for commodities, with rates markets focused on Wednesday's FOMC minutes at 14:00 ET and today's 3-year note auction at 13:00 ET. Cross-asset, equity futures are slightly heavy (S&P complex around minus 0.1 percent, Nasdaq near minus 0.9 percent), volatility gauges are modestly bid near 15.9, and gold is off about half a percent near 4,144, a mild risk-off tilt that is not yet a stress signature. Within the energy complex, the strength is in products, and that product-led support tends to put a base under front-month dips even when the headline supply picture is bearish.
The trade: buy the pivot confluence
Washed-out oscillators and a weakening sell-side composite meet a live catalyst, with a four-level support confluence directly below price: the daily pivot at 68.54, Monday's close at 68.55, the session open at 68.58, and the one-standard-deviation band at 68.99 above. Buy the 68.55 to 68.75 zone on a morning pullback that holds the pivot after 09:45 ET. Stop 68.00, below the 68.11 one-standard-deviation support and the 68.03 computed target, because a break there says the overnight bid has fully failed. Targets 69.27 (first resistance projection and three-standard-deviation magnet), then 69.74 (overnight high, prior supply shelf), then 69.98 (second resistance projection under the 70.00 handle). From a 68.65 fill on a 0.65 stop that is roughly 1:1.0, 1:1.7, and 1:2.0. Invalidation is two consecutive 15-minute closes below 68.05, or a credible de-escalation headline, whichever comes first. Stand down ten minutes before the 12:00 ET energy short-term outlook release; a materially bearish supply revision there overrides the technical long even from profit.
The alternate carries the trend at its back: short a failed test of the 69.74 to 70.00 supply band if the market gets there without a fresh escalation headline and prints rejection, long upper wicks and momentum divergence on the 15-minute. Entry 69.75 to 69.95, stop 70.35 above the 200-day at 70.22, targets 69.27, then the 68.55 pivot, then 67.83. Stand aside if price opens and holds above 70.00 on escalation (chasing a headline spike is untradeable), if the session compresses into a 68.8 to 69.3 consolidation with no catalyst resolution, or if conflicting strait headlines whipsaw across the pivot more than twice before 11:00 ET.
Today's crude calendar (ET). The midday energy outlook is the day's cleanest scheduled catalyst.
Base case: an early fade of the overnight spike into 68.6 to 68.9, a reversal at the pivot, and an afternoon retest of 69.74.
The overnight bid is real but conditional, and it will be repriced headline by headline. The pivot confluence is where the day's character gets decided.
The complete data picture
Every level and reading from the morning crude review, in full.
| Resistance (bottom to top) | Support (top to bottom) |
|---|---|
| 69.27 first resistance projection (3-SD band 69.30) | 68.99 one-SD band |
| 69.69 to 69.74 9-day MA crossover, overnight high | 68.55 to 68.58 Monday close, session open, low (pivot 68.54) |
| 69.98 second resistance projection (under 70.00) | 68.11 one-SD support; 68.03 computed target (invalidation band) |
| 70.22 200-day average; 70.71 third resistance projection (decisive band) | 67.83 first support projection; 67.40 momentum stall |
| 71.71 momentum-stall reference, last week's recovery high area | 67.10 second support projection on the 67.04 one-month/13-week low; 66.39 third projection |
Moving averages (adjusted continuation): 5-day 68.92, 20-day 75.71, 50-day 85.06, 100-day 81.03, 200-day 70.22, YTD 76.58 (fully inverted stack). Range: June 8 high 92.73, -21%+ in one month; July 2 low 67.04 (one-month and 13-week low); prior week high about 71.7. Complex: crack spread four-year high, gasoline three-week high, front in backwardation; producers +20,394 shorts, swap dealers heavily net short; August contract expires July 21.
Intraday prints: overnight open 68.58, low 68.58, high 69.74, near 69.17, 1.16-point range (about 40% of ATR); Monday RTH -0.14 (-0.20%) close 68.55. Expected range: low 67.85 to 68.10, most likely 68.50 to 70.00, high 70.20 to 70.75; one-ATR band 65.1 to 71.9; practical non-escalation 68.0 to 70.7. Paths: A 40% (pivot holds, dips bought, close 69.3 to 70.0); B 35% (day session sells the premium, pivot fails second test, drift 68.0 to 68.3); C 25% (headline shock, squeeze through 70.71 or dump through 67.8 toward 67.04). Setup: long 68.55 to 68.75, stop 68.00, T1 69.27, T2 69.74, T3 69.98, R:R 1:1.0 / 1:1.7 / 1:2.0. Alternate: short a failed test of 69.74 to 70.00 without a fresh headline, entry 69.75 to 69.95, stop 70.35, targets 69.27, 68.55, 67.83. Macro override: stand down ten minutes before the 12:00 ET energy outlook; a bearish supply revision overrides the long. Calendar (ET): 8:30 US and Canada trade balance; 10:00 Canada Ivey PMI (prior 58.2); 11:00 NY Fed inflation expectations; 12:00 EIA short-term energy outlook (tentative, primary crude event); 1:00 US 3-year note auction; after settle, private weekly inventory survey; Wednesday 10:30 EIA crude inventories (prior -3.775M); Wednesday 2:00 PM FOMC minutes.
A geopolitical bid against a wall of supply.
See how AlgoIndex turns this kind of read into systematic signals. Read today's gold note and the pillar on when the futures market actually trades.
View pricing


