Market Snapshot
At 3:47 PM on Tuesday, while ES futures were grinding out a 52-point recovery rally on ceasefire headlines, five institutional block trades hit the options wire in rapid succession. All five were puts. Combined premium: $398 million. TSLA $500 puts at $116 million. MSFT $460 puts at $63 million. The rally kept running. The institutions kept buying downside protection. ES closed at 6,655, and anyone watching the spot price alone saw a relief bounce. Anyone watching the flow saw something very different.
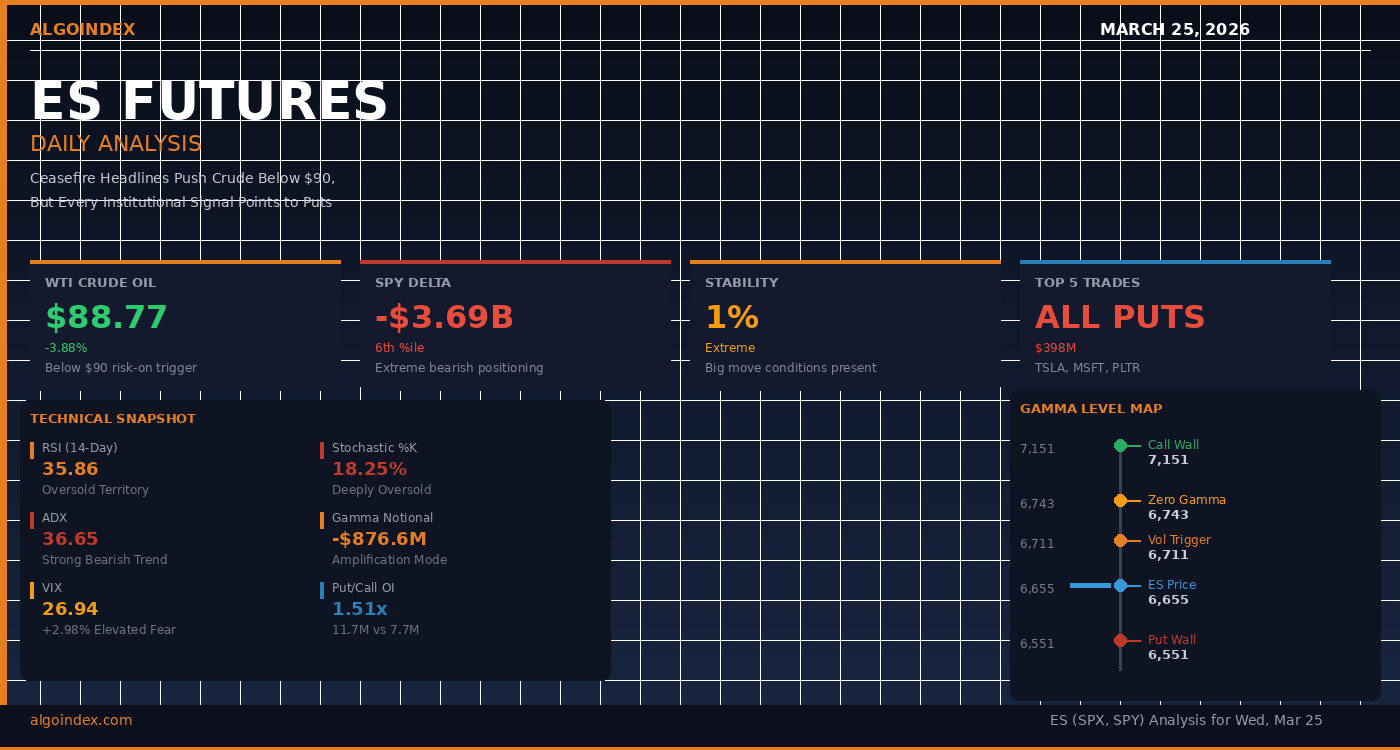
That disconnect is the story heading into Wednesday, and it builds directly on the positioning we documented in yesterday’s Iran reprieve analysis. SPY delta sits at -$3.69 billion, the 6th percentile extreme. The dealer-positioning stability read reads 1 percent, a compression level that precedes outsized moves. Gamma exposure is -$876.6 million, amplifying every tick in both directions. And crude oil, the variable that controls the entire geopolitical risk premium, dropped 3.88 percent to $88.77 on ceasefire progress but sits one EIA report away from reversing back above $90. The market isn’t deciding between bullish and bearish. It’s deciding between a controlled recovery and a gamma-accelerated breakdown.
The Crude Threshold That Changes Everything
If there’s one number that controls ES risk premium today, it’s not the Commitment of Traders or the Fed speakers on the calendar. It’s WTI crude oil at the $90 level. This is the hinge price that shifts institutional risk positioning from “risk on” to “wait and see” to “de-risk now.”
This morning crude dropped 3.88 percent to $88.77, but it’s the intraday behavior that matters. The EIA crude inventory release at 10:30 ET is the session’s critical moment. A significant draw (expectations are around -2.2 million barrels) keeps crude below $90 and maintains the “risk on” bias. A build above expectations pushes crude back to the $92 zone and changes the entire trading day.
| Crude Price Range | Market Bias | ES Target Range | Probability |
|---|---|---|---|
| Below $90 | Risk On | 6,700+ | 45% |
| $90 to $100 | Range Bound | 6,475-6,600 | 35% |
| Above $100 | Downside Risk | 6,300-6,475 | 20% |
Institutional Flow: Every Signal Points Down
This is where the disconnect between spot price and institutional conviction becomes impossible to ignore. The top five largest options trades yesterday were all put spreads, all with significant premium, and all executed against rising prices. That’s the definition of distribution. Smart money is fading the rally.
| Ticker | Premium | Expiry | Strike | Type |
|---|---|---|---|---|
| TSLA | $116.0M | April 25 | $500 Put | BUY |
| TSLA | $97.2M | April 25 | $505 Put | BUY |
| MSFT | $63.4M | April 25 | $460 Put | BUY |
| PLTR | $61.1M | June 20 | $330 Put | BUY |
| MSFT | $61.0M | April 25 | $450 Put | BUY |
The broader positioning data confirms this thesis. SPY delta sits at -$3.69 billion, in the 6th percentile, meaning institutional buyers have drastically reduced long exposure. Across the broader index, we’re at -$4.53 billion in net delta, the 92nd percentile bearish extreme. Put volume yesterday crushed call volume: 1.09 million put contracts versus 846k calls. Put open interest now exceeds call OI by 3.98 million contracts.
The index trades tell the story most clearly. There’s a massive 4,000 to 7,000 long strangle at $520 million premium, putting maximum pain around 6,500. Put spreads are set up for March 30 at the 6,640-6,300 strike (betting on a 4.4% gap down), and April 17 at 6,450-6,000 (betting on a 7.9% move lower). VIX call buying is extreme: May 37 calls with 94,000 contracts at $1.85 premium, and June 120 calls with over 21,000 contracts bought to open. These aren’t hedges, they’re bets on significant volatility expansion.
A Gamma Environment Primed to Amplify
Perhaps the most critical technical data point: SPX carries negative gamma exposure of -$876.6 million. We first flagged this negative gamma acceleration during the triple witching session on March 20, and it has only intensified. This isn’t a theoretical concept, it’s a live fact that changes how price moves. Negative gamma means price moves in both directions are amplified by dealer hedging. If we break above the volatility inflection level at 6,711, dealers are forced to sell, which adds pressure at the top. If we break below support, the opposite happens. In an environment where stability is at 1 percent, this amplification creates outsized moves.
The gamma tilt is 0.711, put-leaning, and the 25-delta risk reversal is -0.088, confirming put skew. With VVIX at 124.14 (volatility of volatility), we’re in the zone where large moves become more likely. The Implied 1-Day Move from options pricing is 45.62 SPX points, or a 6,493 to 6,584 range (roughly). But that’s the statistical expectation. Negative gamma amplifies actual moves well beyond that if we breach key levels.
Technical Structure: Oversold But Not Reversing
Oscillators are screaming oversold. RSI is at 35.86, Stochastic K is at 18.25%, D is at 13.94%, deeply into reversal territory. ADX is 36.65 with a strong bearish tilt: +DI is 12.06, -DI is 37.30. This tells us the trend is unmistakably bearish and has momentum. The problem is that oversold conditions can persist for weeks when there’s a true trend. We’re not seeing a reversal setup, we’re seeing a trend that’s ripe to accelerate if support fails.
35.86 (Oversold)
18.25% (Extreme)
36.65 (Strong Bearish)
| MA Period | Value | Distance from SPX |
|---|---|---|
| 5-DMA | 6,575 | -19 (below) |
| 20-DMA | 6,741 | -185 (well below) |
| 50-DMA | 6,843 | -287 (well below) |
| 100-DMA | 6,830 | -274 (well below) |
| 200-DMA | 6,628 | -72 (below) |
Price sits below every meaningful moving average, a deterioration that accelerated after the 200-DMA break on March 23. The 5-day, 20-day, 50-day, 100-day, and 200-day are all stacked bearishly. Yesterday’s technical composite shifted from 56 percent Buy a month ago to 24 percent Sell. This isn’t a minor deterioration, it’s a structural reversal. The weekly oscillators show readings of 64.45, 56.32, 50.00, and 49.27, which suggests momentum has rolled over at higher timeframes.
| PDH (Prior Day High) | 6,646 | Immediate resistance |
| PDL (Prior Day Low) | 6,573.50 | Support zone |
| ONH (Overnight High) | 6,653.50 | Morning target |
| ONL (Overnight Low) | 6,580 | Gap fill zone |
| VWAP | 6,615 | Fair value anchor |
| Y-VAH (Yesterday Value Area High) | 6,635.50 | Volume support |
| Y-POC (Yesterday POC) | 6,618.50 | Trading anchor |
| Y-VAL (Yesterday Value Area Low) | 6,603.50 | Volume support |
Three Scenarios: Institutional Positioning vs. The Headline
The confluence of data tells us the session will hinge on three outcomes. These probabilities are derived from our options flow data, gamma positioning, and crude oil dynamics. What matters today is which scenario plays out and how fast it happens.
Wednesday’s Defining Moments
The economic calendar carries several moving parts, but one release will dominate: the EIA crude inventory report at 10:30 ET. This is the session’s critical moment. Expectations are for a draw of -2.15 million barrels, which would be bullish for crude prices and supportive of the risk-on case. A build would reverse that narrative immediately.
Resistance and Support Architecture
These are not arbitrary numbers. Each level has multiple confluence points from technical structure, gamma positioning, session mechanics, and volume history. The top resistance zones are defined by prior day highs, pivot calculations, and gamma amplification thresholds. The support levels are built from institutional option positioning and volume anchors.
Primary Trade Setup
Long entry at PDH (6,646) with a tight stop at VWAP (6,615) targets volatility inflection level (6,711) where gamma conditions shift. This setup assumes the ceasefire narrative holds and crude remains below $90. The 2.8:1 risk-reward ratio is attractive for a high-probability range trade. Alternative: Short from volatility inflection level with target at Put Wall (6,550) if rejection occurs.
Market Internals (End of Day)
The Bottom Line
Tuesday’s close disguised a setup that institutional traders can read plainly. The narrative says ceasefire, the price says relief rally, but the options market screams exhaustion. Every major institutional trade yesterday was a put spread. Delta positioning is in the 6th percentile extreme. Stability is at 1 percent, compression at maximum.
Wednesday will pivot on crude oil. If the EIA report shows the expected draw and crude holds below $90, we get the bullish case: gap up, test volatility inflection level, potential spike toward 6,711. But the put wall at 6,500-6,551, the institutional put spreads targeting 6,475 and 6,300, and the extreme negative gamma tell us that institutional conviction is on the downside. They’re willing to let the rally run, testing their sell zones carefully, waiting for distribution to complete.
If Iran denies the ceasefire talks or crude spiking to $92+, this changes entirely. Put protection becomes execution. The Put Wall becomes a target, not a level to test. Negative gamma acceleration turns benign weakness into capitulation. The broader correction thesis we outlined in our analysis of whether a market crash is really brewing remains the structural backdrop. Today will tell us which story we’re living. Watch the 10:30 EIA data, and use the opening gap to size up where institutional conviction really sits.
The last time institutional put positioning reached this percentile extreme while stability compressed to single digits, the move that followed covered the entire implied range in a single session.
Continue reading: Our March 26 analysis covers how Iran’s ceasefire rejection deepened the negative gamma environment, with MSFT institutional puts totaling $246M and Thursday’s setup targeting 6,615.
Past results are not indicative of future performance. This content is for informational and educational purposes only and does not constitute financial advice or a recommendation to buy or sell any security or futures contract. For our full performance disclosure, visit algoindex.com/performance-statement.
Data sources: Options flow analysis, gamma metrics, technical indicators, and economic calendar. All levels as of market close March 24, 2026. View our signal packages.
Join the Discussion
Connect with other ES futures and SPY options traders. Share setups, discuss levels, and get real-time market insights from our community.
Join AlgoIndex Trading Community