Between 6:00 AM and 2:00 PM on Tuesday, April 8, the Iran ceasefire narrative that powered an overnight 195-point surge from 6,652 to 6,847 methodically collapsed headline by headline. Iran’s parliament speaker Ghalibaf declared there is no ceasefire. Hormuz remained closed. Missiles hit Qatar’s Al Udeid Air Base, Kuwait’s Ali Al Salem, and Saudi Arabia’s east-west crude pipeline. ES dropped 95 points from its overnight high to 6,752 as each escalation registered. Then price recovered to close at 6,817, up 2.41% on the day, and the headline looked healthy.
The headline lied.
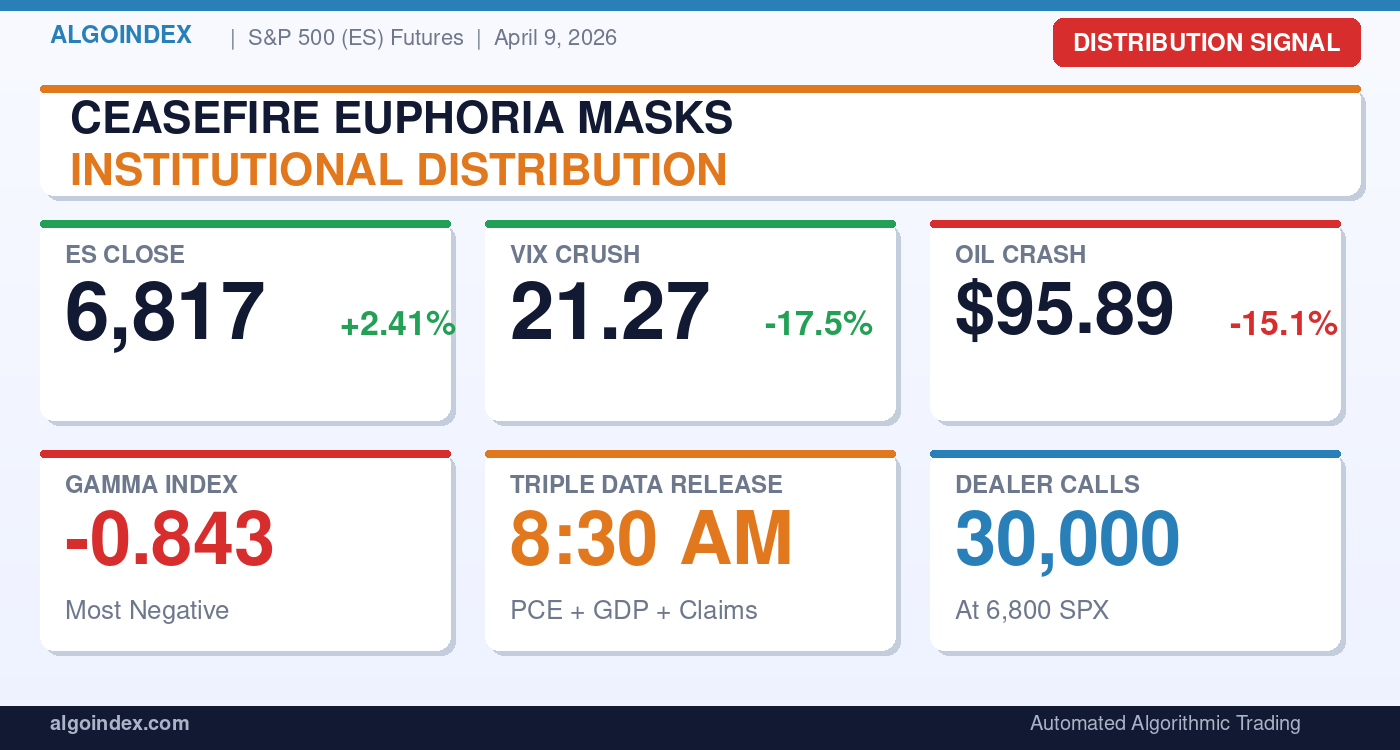
Real-time options flow data told a different story entirely. Cumulative hedging delta cratered to negative $3 billion at midday, the deepest negative reading of the session, while price was rallying back toward the high. Order flow analysis confirmed the divergence: cumulative volume delta printed negative 17,940 contracts on the session with a 13% order book imbalance skewed to sellers. Institutions used the bounce to distribute, and the data leaves no room for ambiguity. Thursday’s triple data release at 8:30 AM, Core PCE, GDP, and initial jobless claims simultaneously, arrives into a market where implied volatility was crushed 7 to 10 points and dealers sit at their most negative gamma reading in sessions.
The Ceasefire That Unraveled in Six Hours
The timeline tells the story of how euphoria became confusion. Pre-market reports of an Iran ceasefire agreement and Hormuz reopening sent ES surging to 6,847.25, the highest level since late March. At 10:00 AM, Ghalibaf’s statement that there is no ceasefire shaved the first layer of conviction. By 11:30 AM, Iran confirmed Hormuz remained closed. The missile attacks on three separate military targets between 12:45 PM and 2:00 PM represented physical escalation that contradicted the diplomatic narrative entirely.
Ceasefire Collapse Timeline – April 8
Pre-Market
Ceasefire Reports & Hormuz Reopening
ES surges to 6,847.25 overnight high
10:00 AM ET
Ghalibaf: “There is No Ceasefire”
Iran parliament speaker denies agreement
11:30 AM ET
Hormuz Remains Closed
Iran confirms strait still blocked to shipping
12:45 PM – 2:00 PM ET
Triple Missile Attack
Qatar Al Udeid, Kuwait Ali Al Salem, Saudi pipeline
2:00 PM ET
FOMC Minutes Released
“Remarkably uncertain” outlook, largely ignored
Yet price held. The options-derived implied move low at 6,752.24 caught the selloff almost to the tick, demonstrating how gamma mechanics, not genuine risk appetite, drove the recovery. FOMC Minutes released at 2:00 PM added a “remarkably uncertain” economic outlook but were largely ignored as geopolitical headlines dominated. The closing print at 6,817 looked like a victory. The breadth data said otherwise.
Distribution Under the Surface
The breadth divergence on April 8 was among the most pronounced this year. The headline gain of 160.50 points masked internals that painted an entirely different picture. TICK reached 9,326 but was declining, a level that historically signals buying exhaustion and precedes mean reversion. Advancing minus declining issues was negative 77. On a day the S&P 500 gained 2.4%, more stocks fell than rose. VOLD closed at zero net delta, meaning volume was not confirming the rally at all. This is the signature of index-level gamma mechanics and a handful of mega-cap names driving the headline while the broader market sits out.
Options Flow Whipsaw – Session Progression
Morning
+$500M
Euphoria
Ghalibaf
-$200M
Denial
Lunch
+$225M
Fade
Midday
-$3B
Extreme
Close
Flat
Mean-reverted
The options flow data adds institutional confirmation to the breadth divergence. Real-time hedging flow followed an extreme whipsaw pattern through the session: positive $500 million on ceasefire euphoria in the morning, crashing to negative $200 million on the Ghalibaf headlines, bouncing to $225 million on headline fade, then dropping to roughly negative $3 billion at the midday extreme. By the close it had mean-reverted to approximately flat. The midday extreme, not the closing read, reveals what institutions actually did when headlines turned negative. Zero-day options flow drove the majority of the swings, with 99th percentile gamma forming near the 6,780 strike. As we documented during the March 26 Iran rejection session, divergence between surface price action and underlying options flow at extreme levels typically resolves in the direction the flow suggests.
Notable Institutional Flow – April 8
| Ticker | Position | Size | Signal |
|---|---|---|---|
| SPY | May 530P SOLD | 150K contracts | Hedge Unwind |
| SPY | May 575P BTO | 30K contracts | Downside Bet |
| VIX | May 50C BTO | 38K contracts | VIX to 50 Bet |
| QQQ | 573P BTO | 50,116 contracts | Downside Hedge |
| RKLB | Calls BTO | $54M premium | Bullish |
Gamma Mechanics Create Amplification Risk
The gamma environment heading into Thursday is the most negative in recent sessions. The gamma index deepened to negative 0.843, worse than the negative 0.651 reading from the prior session. This means any directional move will be amplified by dealer hedging activity. The gamma stability reading sits at 23%, well below the 30% threshold that marks “big move territory.” Negative gamma concentration at the 6,780 to 6,820 area means moves from current levels get pushed further rather than dampened.
Gamma & Options Positioning Framework
| Level | SPX | ES (approx) | Significance |
|---|---|---|---|
| Resistance | 6,800 | 6,840 | Grinding resistance, 30K short calls |
| Call Wall | 6,700 | 6,739 | Major gamma level, pivot (bullish above) |
| volatility inflection level | 6,600 | 6,639 | Volatility shift line |
| gamma flip level | 6,578 | 6,617 | Flip point: amplification below |
| Put Wall | 6,500 | 6,539 | Maximum downside target |
| Implied Move | 6,746 – 6,835 | 6,785 – 6,875 | 1-day expected range (Thu) |
The key resistance framework centers on 6,800 SPX, approximately 6,840 ES. The institutional thesis describes this as “grinding resistance” with 30,000 dealer short calls at the 6,800 strike creating a local gamma ceiling. The implied one-day move range spans 6,745.83 to 6,835.47, giving roughly 90 points of room to the downside versus only 50 points to the upside from the close. The asymmetry favors the short side at resistance.
Critically, implied volatility was crushed 7 to 10 points across all expirations of two days or fewer. If Thursday’s triple data release surprises to the upside on inflation, the volatility repricing alone could drive a sharp move lower as dealers scramble to re-hedge in deeply negative gamma territory. The gamma tilt at 0.897 reflects continued bearish skew, and gamma notional at negative $57.16 million in SPX terms confirms dealers remain positioned for downside acceleration. The broader correction dynamics we have tracked since our original crash analysis continue to frame the macro backdrop even as short-term ceasefire pricing dominates.
Statistically Significant Positions
QQQ Gamma
$454.4M
99th Percentile
IWM Vega
$1.1M
96th Percentile
MSTR Vega
$0.4M
100th Percentile
What Thursday’s Triple Release Means at 8:30 AM
8:30 AM ET
Core PCE
Fed’s preferred inflation gauge
Consensus: near 2.8% trend
8:30 AM ET
GDP Advance
Growth estimate
Soft = stagflation fears
8:30 AM ET
Jobless Claims
Weekly labor health
Rising = dual mandate concern
Core PCE, the Fed’s preferred inflation gauge, arrives alongside GDP advance estimates and initial jobless claims at 8:30 AM. Consensus expects Core PCE to continue near the 2.8% trend. Any surprise higher, especially with oil’s post-ceasefire repricing still filtering through supply chains, could crush remaining rate cut expectations. A soft GDP reading would confirm the stagflation narrative that FOMC officials flagged as “remarkably uncertain.” This combination of PCE plus GDP arriving after implied volatility was crushed 7 to 10 points creates a loaded catalyst. The market is priced for calm after ceasefire. If data disrupts that calm, gamma amplification does the rest.
Crude Oil: The Coiled Spring
Price
$95.89
-15.10% on ceasefire
EIA Inventory
-2.696M bbl
vs +0.400M expected
Signal
Divergence
Physical tight, price collapsed
Meanwhile, the physical oil market sends its own signal. Crude collapsed 15.1% to $95.89 on ceasefire pricing despite an inventory draw of 2.696 million barrels versus an expected build of 400,000. The disconnect between tightening physical supply and collapsing price creates a coiled spring: if the ceasefire narrative fractures again, the oil reversal could be violent. After-hours futures already edged lower on “ceasefire concerns,” and IRGC commanders maintained their military posture through Tuesday evening.
Notable institutional flow included VIX 50 calls bought in May expiration at 38,000 contracts, suggesting someone is betting the VIX returns to 50 within six weeks. QQQ gamma reached the 99th percentile at $454.4 million in dealer hedging. This is not the positioning of a market that believes the ceasefire resolves cleanly. As the March 27 Iran deadline extension session demonstrated, data releases into fragile geopolitical ceilings tend to produce outsized moves. Wednesday’s session recap covered the mechanics of the put unwind. Thursday will reveal whether that unwind has further to run or whether distribution wins.
Primary Setup: Short from 6,830 – 6,847
Entry
6,830 – 6,847
Session high rejection / Fib 2.0
Stop Loss
6,865
Above Fib 2.0 with cushion
Target 1 / Target 2
6,795 / 6,746
Fib 1.618 / Fib 1.272
Target 3
6,700
Call Wall / round number
Key Levels for April 9 (Thursday)
| Level | ES Price | Confluence |
|---|---|---|
| R1 | 6,847 | Session high / Fib 2.0 extension |
| R2 | 6,875 | Implied move high / Round level |
| R3 | 6,900 | Major round number / 4H Strong High |
| Pivot | 6,815-6,820 | Close area / VWAP / Equilibrium |
| S1 | 6,795 | Fib 1.618 / Intraday support |
| S2 | 6,780-6,785 | Implied move low / Neg. gamma zone |
| S3 | 6,746 | Fib 1.272 extension |
| S4 | 6,700 | Call Wall / Major structural level |
The one-day move envelope, the gamma ceiling, the breadth divergence, and the triple data catalyst all converge at the same conclusion: this is a fade at resistance, not a breakout.
Article Brief
Instrument: ES (E-mini S&P 500 Futures)
Session: April 8, 2026 (Post-Close Analysis for April 9)
Close: 6,817.25 (+160.50, +2.41%)
Bias: Bearish fade at resistance
Primary Setup: Short 6,830-6,847 / Stop 6,865 / Targets 6,795, 6,746, 6,700
Next: ES Futures: The 0DTE Mirage Meets CPI Reality (April 10, 2026)
This analysis is provided by AlgoIndex for informational purposes only and does not constitute financial advice. Futures and options trading involves substantial risk of loss. Past performance is not indicative of future results. See our full performance statement for details. Ready to access institutional-grade analysis every session? See our plans.
Join the Discussion
Connect with other ES futures and SPY options traders. Share setups, discuss levels, and get real-time market insights from our community.
Join AlgoIndex Trading CommunityFoundational guides
New to S&P 500 futures? Start with What Are ES Futures, the ES, NQ, MES & MNQ point value and contract specs, gamma exposure (GEX) explained, and market internals: TICK, ADD, VOLD and VIX.