Monday’s Session in Three Numbers
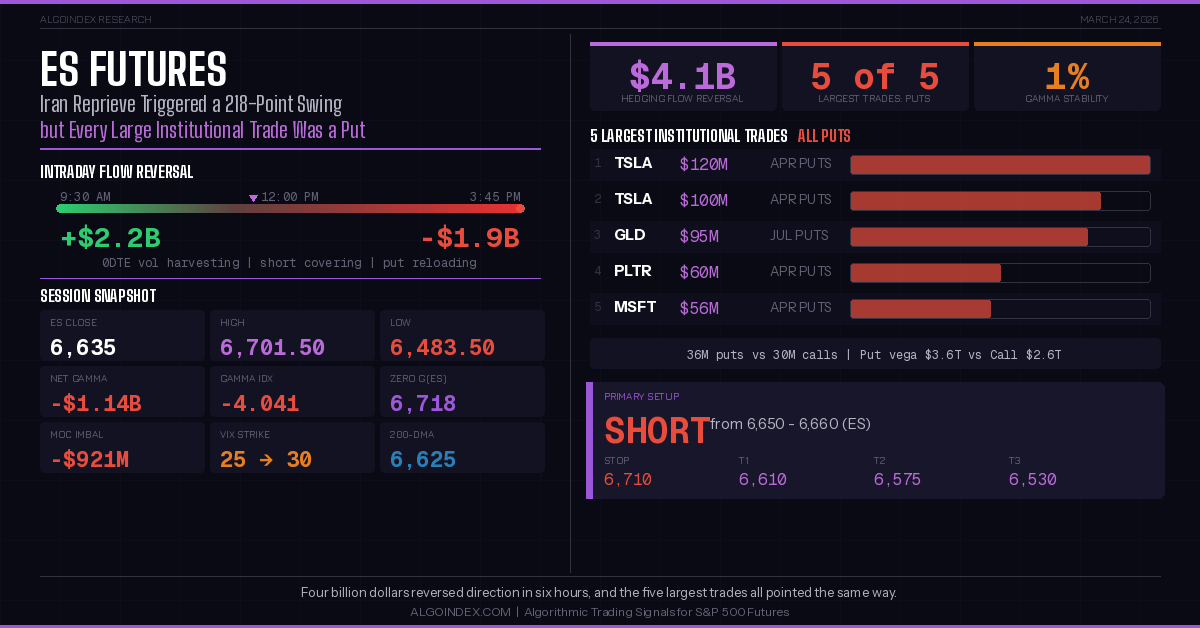
$4.1B
Hedging flow reversal (morning to close)
5 of 5
Largest institutional trades were puts
1%
Gamma stability into close
Between 9:30 AM and 3:45 PM on Monday, the cumulative options delta on SPX swung from positive $2.2 billion to negative $1.9 billion, a $4.1 billion reversal that unfolded while ES futures rallied 218 points from the Globex low and the financial media declared the Iran crisis “de-escalating.”
That number, $4.1 billion, is the distance between what the morning looked like and what institutions were actually doing. Trump postponed strikes on Iranian energy infrastructure, called talks “productive,” and oil crashed more than 10% with Brent dropping below $100. ES surged from 6,483.50 to 6,701.50 in the first two hours. And through every tick of that rally, the largest money in the market was selling into it, reloading put positions, and harvesting volatility premium from traders who mistook a geopolitical headline for a structural shift. By the close, ES had given back nearly half the morning gains, settling around 6,635 with a $921 million market-on-close sell imbalance confirming what the flow data had been signaling all session.
What the Morning Rally Was Made Of
The composition of Monday’s flow tells a different story than the price action. Real-time hedging flow peaked at positive $2.2 billion during the morning, but that number was built on $2.7 billion in same-day put selling and $1.6 billion in same-day call selling. This was volatility harvesting, not directional conviction. Institutions were collecting premium from the fear trade, not positioning for sustained upside.
Longer-dated flow was minimal. The buying that drove ES from 6,483 to 6,701 came almost entirely from 0DTE options monetization and short covering, the kind of positioning that evaporates overnight and leaves no structural footprint for the next session. When the hedging flow rolled over in the afternoon, collapsing to negative $1.9 billion by 3:45 PM, there was nothing underneath to hold the rally together.
The gamma heatmap confirmed the shift in real time. Negative gamma spread across strikes near the current price throughout the afternoon. The dealer-positioning stability read dropped to 1%, the lowest possible reading, and stayed there into the close. For context on how gamma exposure affects price action, see our complete guide to reading gamma exposure data. Dealers adjusted their hedging for downside risk heading into Tuesday, not for continuation of the morning bounce.
Five Put Blocks and the Distribution Signal
Every single one of the five largest institutional trades on Monday was a put.
TSLA drew the two biggest, at $120 million and $100 million in April expiration puts. GLD attracted $95 million in July puts, suggesting macro hedging against a deterioration in the geopolitical outlook rather than an equity-specific bet. PLTR and MSFT rounded out the list at $60 million and $56 million respectively. Aggregate flow showed 36 million put contracts versus 30 million calls, with put vega at $3.6 trillion against call vega of $2.6 trillion.
This is not the positioning profile of a market that believes the Iran crisis is resolving. It is the profile of institutions using a headline-driven rally to reload bearish exposure at better prices.
The $921 million MOC sell imbalance added confirmation. Institutions that had been patient through the morning waited until the close to execute their distribution. Monday printed a long upper wick on the daily chart, high of 6,701.50 against a close of 6,635, the kind of candle that technical analysts call a shooting star and that options desks call an opportunity to sell the rip.
One Percent Stability and a Contradiction That Cannot Hold
Net gamma exposure sits at negative $1.14 billion with a gamma index reading of negative 4.041. The dealer-positioning stability read reads 1%. Conditions like these do not persist, they resolve, and the resolution typically comes as a large directional move rather than a slow grind.
gamma flip level sits at SPX 6,666, roughly ES 6,718. Price closed well below it. In negative gamma territory, dealers hedge in the same direction as price movement, which means selling accelerates selling and buying accelerates buying. The morning proved the upside version of this effect. Tuesday could prove the downside version if selling pressure emerges at the open.
The deeper structural concern is the March 31 expiration of the institutional collar at SPX 6,475. That position, which has bounced price twice already and represents the single most-watched level in the market, disappears in six trading days. Options flow data shows negative gamma building toward SPX 6,000 as the next major support level after the collar rolls off. Meanwhile, 78,000 put spreads targeting 250 points of additional downside by March 27 represent a concentrated bet that the collar level breaks before month-end.
VIX positioning adds fuel. Dealers remain short approximately 149,000 VIX 25 calls and 238,000 VIX 35 calls. If volatility rises, dealers must buy VIX futures to hedge, pushing VIX higher, increasing delta on the calls, forcing more buying. The VIX key delta strike shifted from 25 to 30, meaning the market is pricing the possibility of VIX reaching 30 or higher this week.
The Five-Day Window
Trump’s reprieve gave Iran five days. Iran’s Supreme Leader’s military adviser responded that “war continues until all sanctions are lifted.” The White House is reportedly considering Iran’s parliament speaker as a potential US-backed leader. US Marines are set to arrive in the Middle East to coincide with the reprieve deadline. Netanyahu called an emergency coalition meeting over concerns about a “bad deal.”
The probability-weighted outcome leans bearish because Iran has denied talks at every stage of this conflict, and domestic political dynamics in Tehran make near-term concessions unlikely. If the reprieve window passes without a deal, oil spikes back toward $95 and the selling resumes with the structural support of negative gamma amplifying every move lower.
The 200-day moving average at SPX 6,625 was broken Friday and now sits overhead as resistance. Price is below every short-term moving average. RSI at 37.19 is bearish but not yet oversold, and ADX at 35.53 confirms a strong directional trend rather than conditions for mean reversion.
Four billion dollars reversed direction in six hours on Monday, and the five largest trades of the day all pointed the same way.
Primary Setup
Short from 6,650-6,660 (ES) | Stop 6,710 | Targets: 6,610 / 6,575 / 6,530
Morning test of the options-implied 1-day move high and yesterday’s point of control. Negative gamma, institutional put loading, Iran reprieve uncertainty, afternoon hedging flow collapse, and 200-DMA overhead create high-conviction continuation short conditions. Wait for real-time flow confirmation of bounce exhaustion before entry.
Based on historical backtesting, post-distribution short setups from the value area high with confirmed flow reversal have a favorable risk-reward profile.
The session that followed, where ceasefire headlines collided with the most extreme put positioning of the week, is covered in our March 25 analysis.
Past results are not indicative of future performance. This content is for informational and educational purposes only and does not constitute financial advice or a recommendation to buy or sell any security or futures contract. For our full performance disclosure, visit algoindex.com/performance-statement.
AlgoIndex Research · algoindex.com · Start your free trial
Join the Discussion
Connect with other ES futures and SPY options traders. Share setups, discuss levels, and get real-time market insights from our community.
Join AlgoIndex Trading CommunityFoundational guides
New to S&P 500 futures? Start with What Are ES Futures, the ES, NQ, MES & MNQ point value and contract specs, gamma exposure (GEX) explained, and market internals: TICK, ADD, VOLD and VIX.