Breaking Situation Report
Iran Peace Talks Collapse After 21 Hours. Trump Threatens Full Naval Blockade. JPMorgan Reports Monday.
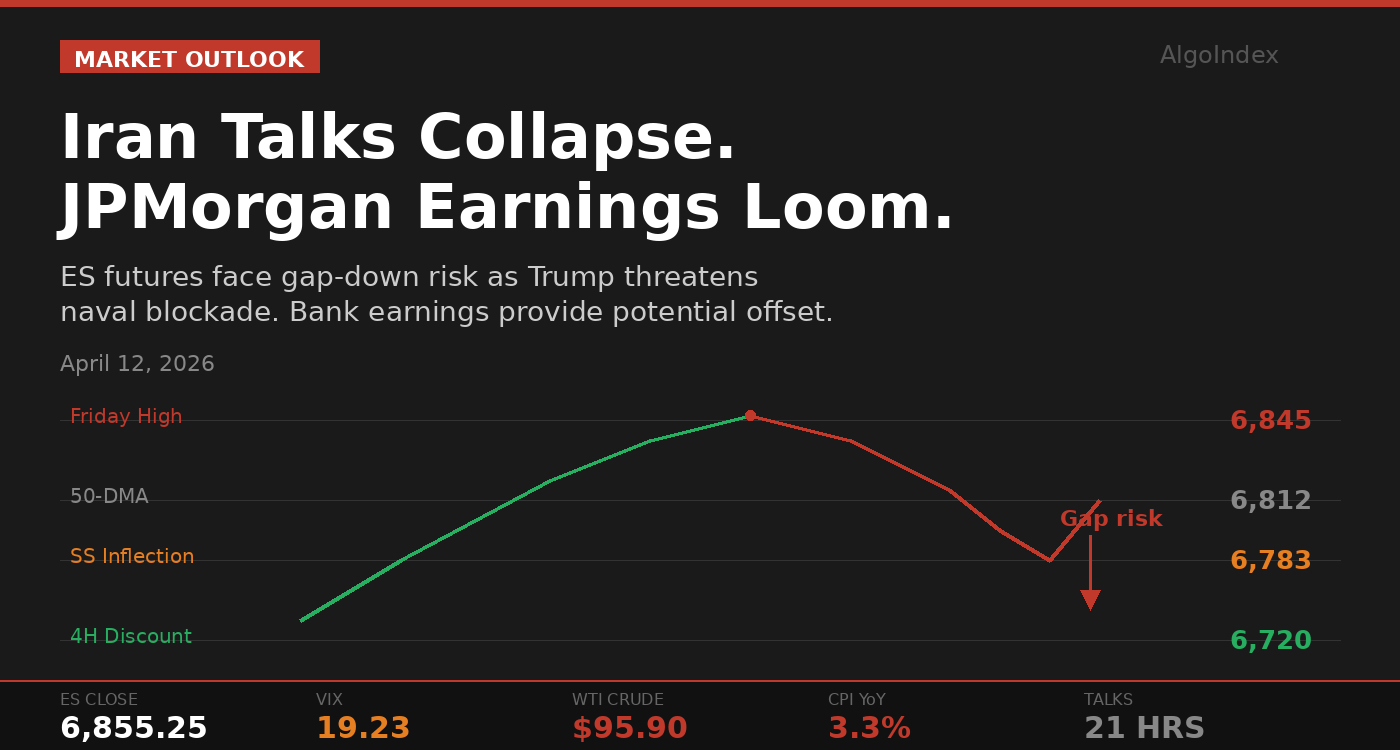
ES futures closed Friday at 6,855.25 after touching a 5-week high at 6,845. Sunday evening opens into diplomatic wreckage and bank earnings. The market must price a contradiction: political collapse versus physical reopening of Hormuz.
Twenty-one hours. That is how long Vice President JD Vance sat in Islamabad before walking away without a deal. By Sunday morning, Iran’s parliament speaker was telling state media that America “did not succeed in gaining the trust of the Iranian government,” and President Trump was threatening a full naval blockade of Iranian waters, complete with interdiction of commercial vessels in international shipping lanes. ES futures, which closed Friday at 6,855.25 after touching a five-week intraday high at 6,845, now face a Sunday evening open with the ceasefire’s diplomatic scaffolding in pieces.
The complication is that the ceasefire’s physical reality is running ahead of its political failure. Three fully laden supertankers transited the Strait of Hormuz on Saturday, the first commercial passage since hostilities began. That operational fact, tankers moving through the chokepoint that handles 20% of global oil flows, creates a support base under risk assets that pure headline panic would otherwise obliterate. The market on Monday morning will price two contradictory signals simultaneously: a diplomatic collapse that should spike oil and VIX, and a physical reopening of Hormuz that argues the worst-case energy scenario is retreating. JPMorgan’s Q1 earnings before the bell will determine which signal wins.
The Ceasefire’s Structural Contradiction
Pakistan brokered the original two-week ceasefire on April 7, producing the largest single-session rally since the conflict began. We covered that 245-point V-reversal in detail, including the $3.2 billion swing in cumulative options delta that accompanied it. The terms were always aspirational: immediate halt to hostilities, Hormuz reopening, and a 15-to-20-day negotiating window. Iran’s 10-point counterproposal demanded complete sanctions removal, acceptance of enrichment rights, and withdrawal of all U.S. combat forces from the region, conditions so far from Washington’s stated positions that the negotiation was less a dialogue than parallel monologues delivered in the same room.
Structural Energy Damage (Irreversible by Ceasefire)
Saudi Production Cut
-600K bpd
East-West Pipeline
-700K bpd
Qatar LNG Offline
17% capacity
3-5 year repair timeline
Facilities Damaged
8+ facilities
Lengthy repair timelines
Oil closed Friday near $95.90 on WTI, still roughly 35% above pre-conflict levels despite the ceasefire’s steep discount from the $118 peak. Sunday evening futures will test whether the Hormuz transit data can hold crude below $100 against the backdrop of Trump’s blockade rhetoric. That oil print will set the tone for ES before JPMorgan even reports.
CPI, Consumer Sentiment, and the Macro Squeeze
Friday’s March CPI delivered the single largest monthly headline print in nearly four years. The 0.9% monthly surge pushed annual headline inflation to 3.3%, the highest since May 2024. The core reading at 0.2% monthly provided brief relief, but economists noted that medical care and legal services declines artificially depressed the number, with reversals likely in coming months. Average hourly earnings growth at 3.5% is now dangerously close to headline inflation at 3.3%, compressing real wages toward zero.
The University of Michigan consumer sentiment index then cratered to a record low in the April preliminary reading, 10.7% below consensus. Professional traders shrugged off the soft data initially, pushing SPX to its intraday high near 6,845 on the core CPI beat. But the sentiment collapse triggered a sharp late-session reversal that erased the morning’s gains. Software stocks bore the brunt, with Fastly dropping 21%, Akamai 16%, and Cloudflare 13% on AI disruption fears, dragging the broader market into a bearish engulfing candle on the daily chart.
Federal Reserve Policy Status
3.50-3.75%
Fed Funds Rate (Held)
30%
Prob. of Cut by Dec ’26
May 15
Powell Term Expires
The March FOMC minutes revealed “some” officials discussed rate hikes while “most” still viewed cuts as baseline. Futures markets price a deep freeze through early 2027. Next meeting: April 28-29.
Monday’s Technical Architecture
The daily chart shows a V-shaped recovery from the April 7 low at 6,616 to Friday’s high at 6,845, roughly 229 points in three sessions, followed by a bearish engulfing reversal that closed at 6,817. The index sits between the 50-DMA at 6,783 and the 100-DMA near 6,810-6,815, with both acting as magnets. The 200-DMA at 6,644 remains the longer-term dividing line after holding multiple tests during March.
Daily Moving Average Stack
Rising
Turning
Key
At price
Support
SPX Friday close: 6,817 | Sitting between the 50-DMA and 100-DMA. 50-day crossed below 200-day in late March (bearish signal).
On the 4-hour chart, the recovery leg shows declining volume and a weaker impulse on the third push higher, characteristic of momentum exhaustion. The discount zone for any bullish continuation sits at 6,740-6,760. A break below 6,720 on a 4-hour closing basis would invalidate the near-term bull structure entirely.
The weekly picture carries its own warning. The 50-day moving average crossed below the 200-day moving average in late March, a signal historically associated with extended consolidation or continued downside pressure. The weekly RSI at 46-48 is improved from March’s oversold readings but insufficient to signal broad conviction. This recovery, as we examined in our analysis of the correction thesis, remains a counter-trend bounce within a larger distribution pattern until proven otherwise.
JPMorgan: The Fundamental Anchor
JPMorgan Chase reports Q1 2026 earnings before the bell Monday, with consensus at $5.32 to $5.50 EPS, roughly 7% year-over-year growth. The Q4 2025 miss (actual $4.63 versus $4.85 forecast) remains a fresh scar, and any sign of deteriorating consumer credit quality or cautious net interest income guidance will compress the entire financial sector. Goldman Sachs also reports Monday, with revenue consensus near $16.9 billion.
JPMorgan (JPM)
MON BMO
$5.32-$5.50
~7%
NII, credit quality
Goldman Sachs (GS)
MON BMO
$16.9B
~$14.50
IB fees, trading rev
Bank of America (BAC)
WED
~$1.00
Trading desk, NII
Wells Fargo (WFC)
REPORTED
$1.58
Asset cap, NIM
The earnings carry an outsized role this week because they represent the first authoritative read on how Wall Street weathered the conflict’s most volatile weeks. Trading revenue should benefit from elevated volatility, but energy-linked loan loss provisions, consumer credit deterioration, and commercial real estate exposure are the variables that will determine whether the headline number carries weight or conceals cracks. Bank of America follows Wednesday, creating a three-day earnings gauntlet that either builds a fundamental foundation for the recovery or exposes structural fragility beneath it.
Key Resistance Levels
| R3: 6,920-6,950 | Pre-conflict structural high from late February. Significant supply overhang from prior distribution phase. |
| R2: 6,880-6,900 | Options-related open interest concentration and late-February consolidation zone. The “all-clear” level for bulls. |
| R1: 6,845-6,850 | Friday’s 5-week high where SPX reversed sharply. Potential double top on any retest. |
Key Support Levels
| S1: 6,800-6,808 | Friday’s session low and consolidation base. First meaningful support on any Monday pullback. |
| S2: 6,760-6,770 | The ceasefire gap zone from April 8. High-volume area that should attract buyers on a retest. |
| S3: 6,720-6,730 | Critical structural inflection. Below here, the recovery built since April 7 breaks down entirely. |
| S4: 6,644 | 200-DMA. The longer-term bull/bear dividing line. Multiple March tests held here. |
Primary Setup
Short from 6,835-6,845 (ES) | Stop 6,857 | T1: 6,805 | T2: 6,780
Fade the gap-fill rally into Friday’s failed breakout zone. Entry only after 9:45 AM ET with a rejection candle on the 15-minute chart. Risk/reward approximately 1:2. If WTI crude sits below $96 at entry time, reduce position size by 50%. If JPMorgan credit quality is materially better than feared, skip entirely.
Based on historical backtesting.
For the latest developments three sessions later, see our April 15 analysis on the VIX Cliff at 7,002 ATH and the hidden institutional defense flow building underneath.
Past results are not indicative of future performance.
The ceasefire’s two-week window expires around April 22. Whether the Hormuz supertankers keep moving or the naval blockade rhetoric becomes operational reality will matter more than any single earnings print, but Monday belongs to JPMorgan, and the market will follow wherever Jamie Dimon points.
For context on how the ceasefire initially shifted institutional positioning, see our quarter-end OPEX analysis and the March 25 ceasefire session review.
Past results are not indicative of future performance. This content is for informational and educational purposes only and does not constitute financial advice or a recommendation to buy or sell any security or futures contract. For our full performance disclosure, visit algoindex.com/performance-statement.
AlgoIndex Research · algoindex.com · Start your free trial
Join the Discussion
Connect with other ES futures and SPY options traders. Share setups, discuss levels, and get real-time market insights from our community.
Join AlgoIndex Trading CommunityFoundational guides
New to S&P 500 futures? Start with What Are ES Futures, the ES, NQ, MES & MNQ point value and contract specs, gamma exposure (GEX) explained, and market internals: TICK, ADD, VOLD and VIX.