
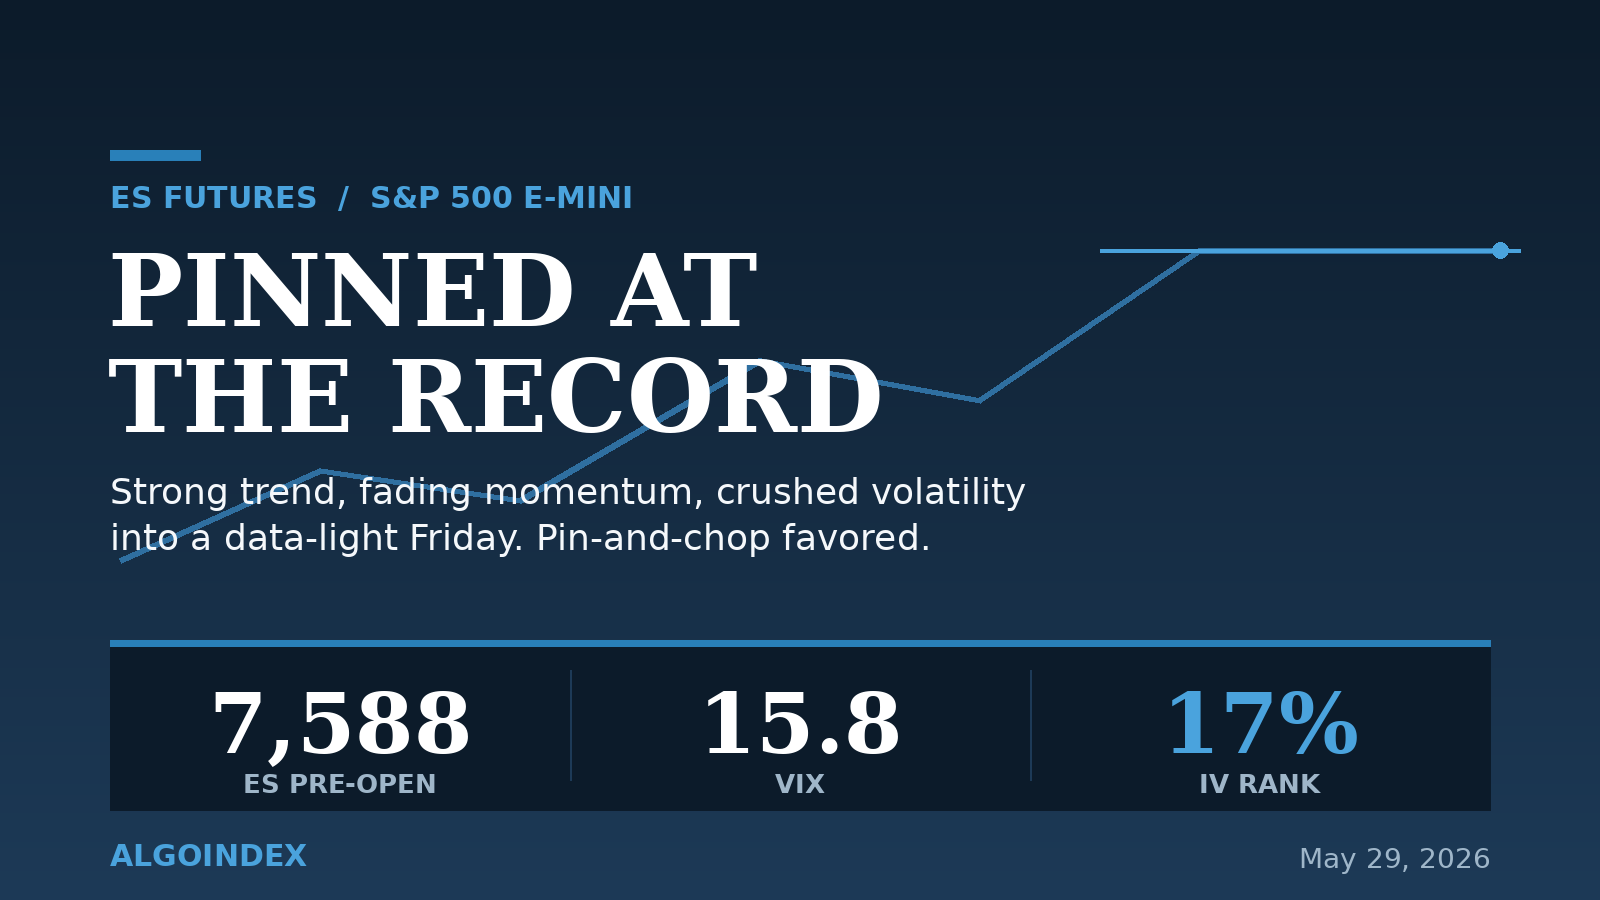
At 8:40 on Friday morning, ES sat four points under its own record and refused to move. The overnight band held a narrow shelf between roughly 7,586 and 7,593, directly beneath the 7,595.75 print it tagged on Thursday, on small-bodied candles and light volume. The daily bar so far reads like a compressed spring: open 7,587.50, high 7,595.75, low 7,572.75, last near 7,588, an inside-ish range pressing the highs without expanding through them. Nothing about the price action said breakout. Nothing said breakdown either. The market was waiting.
That stillness is the story. The S&P enters Friday at all-time highs, with SPX cash closing 7,563.63 on Thursday, up 0.58%, and futures running about 24 to 25 points over cash. Every timeframe from weekly to hourly points up, price sits above all six major moving averages, and the multi-indicator composite reads a maximum-strength 100% buy. This is a trend that has earned respect. Yet the same oscillators confirming the move are jammed in extreme overbought territory, the four-hour and daily momentum studies are tracing lower highs against price's higher highs, and implied volatility has been crushed to levels that say the options market expects almost nothing to happen. An extended trend, fading thrust, compressed volatility, and a heavy round-number call concentration overhead is a recipe for rotation, not a clean directional break, unless a headline forces the issue.
The macro backdrop is quiet by design today. There is no PCE, no CPI, no payrolls. The only scheduled US data is Chicago PMI at 9:45 ET, alongside three Fed speakers. With no tier-1 release to wait out, the first-order risk is not data, it is the US-Iran headline flow plus two Fed voters speaking right at the open. The cleanest read into the bell is a range between roughly 7,572 and 7,600 in the ES domain until the 7,595.75 high either breaks on real internals or rejects.
A Trend That Is Real, and Stretched
The strength here is not an illusion. The 14-day directional index reads 28.7 with positive directional movement at 37.7 against just 16.7 on the negative side, and the 9-day reading at 34.4 shows trend strength still accelerating on the short horizon. That is a genuine, powerful uptrend, not chop. The four-hour structure carries the cleanest tradable shape on the board: a higher-high sequence into 7,595.75, a controlled pullback to a 7,515 low, and a V-recovery straight back to the highs. That 7,515 print is the line that defines the near-term trend. It was the breakout pivot and the last higher-low, and losing it opens a deeper unwind toward the fib extensions at 7,486, 7,467, and 7,446.
The cost of the move is distance. Price sits above every major average in a fully stacked bullish alignment, but the gaps are wide: 1.76% above the 5-day at 7,504, nearly 6% above the 20-day at 7,394, 14% above the 50-day at 7,038, and 17.3% above the 200-day at 6,826. Riding that far from the longer-term anchors supports the trend right up until it doesn't, and the kind of distance that opens above the 200-day tends to close violently when it finally cracks. For now, the structure is intact and the higher-low at 7,515 is doing its job.
The Divergence Underneath
Strip away the price and look at the engine, and the picture turns cautious. The 14-day relative-strength reading sits near 73, the 14-day stochastic %K at 93.6 against a %D of 89.9, the 20-day %K at 96.6, and the weekly oscillator near 90. Every horizon is pinned at the top of its range. More telling than the absolute levels is the shape: the four-hour oscillator is printing a lower high while price prints a higher high, and the daily matrix, elevated near 79, carries bearish-divergence markers tagged at the recent extremes. Momentum is not confirming the new price highs.
This is the loss-of-thrust signature that precedes most rotations at a cycle high. It does not demand a reversal, and trend-followers have every reason to stay long while the directional index holds. But it does argue against chasing a fresh breakout at the record, and it gives mean-reversion scalpers a defensible reason to fade extremes into resistance. The trade is rotation inside a range, not a one-way push.
What Cheap Volatility Is Telling You
Volatility tells the same range-bound story from a different angle. One-day at-the-money implied volatility sits at 11.4% against historic volatility near 10.1%, the volatility index reads 15.8, and the implied-volatility rank is just 17%. Historic volatility on the 14-day window runs about 9.4%. The options market is pricing a quiet day and almost no fear. The expected-range math is just as tight: the 14-day average true range is 70.5 SPX points, the 9-day 67.5, the 20-day 73.3, and the average daily range 58.6 points. A one-ATR projection off 7,588 frames a session envelope of roughly 7,553 to 7,623, about 70 points, and the bulk of the probability lives inside that band.
In a low-volatility, positive-gamma state, the heaviest call concentration acts as a magnet, dampening realized moves and pulling price toward the strike rather than away from it.
Where the Options Market Draws the Lines
The heaviest concentration on the board is the call structure at SPX 7,600, which maps to roughly ES 7,624 and carries 18,928 contracts of volume against 7,093 in open interest, the single largest strike anywhere on the chain. A secondary call grouping sits at SPX 7,550 to 7,560. In a low-volatility, positive-gamma state like this one, that 7,600 strike acts as a near-term cap: dealer hedging dampens realized moves and pulls price toward the heaviest concentration rather than away from it. That mechanically reinforces the pin between the overnight shelf and the 7,600 area. Cheap volatility and a grinding session are exactly what you would expect dealers positioned long gamma up here to produce, and the one-day implied volatility at 11.4% confirms minimal expected movement is being priced.
Quiet Data, Loud Headlines
The dollar is roughly flat at 99.06 and gold is firm near 4,547, up 0.3%, with no flight-to-safety signal in the cross-asset picture. Crude is the tell: WTI softens toward 87.6, down 1.4%, on hopes that a US-Iran agreement restores oil flows through the Strait of Hormuz. Soft oil, a flat dollar, low volatility, and firm gold together read as benign risk-on, with nothing flashing stress. The leadership underneath is passive rather than fresh: Costco printed after Thursday's close at $4.91 on $69.56 billion of revenue, mega-caps are firm with one large-cap name up 3.5% pre-market, and no major technology print is scheduled to give the index a new catalyst.
Cross-asset snapshot: soft oil, flat dollar, firm gold, low volatility. A benign risk-on read.
The geopolitical thread is the session's real driver. Record highs have ridden optimism that the deal lands, but the counter-risk is Iran's own framing: a senior official stated publicly that there is no trust in guarantees, only actions, and no action before the other side acts. A constructive headline extends the melt-up. A breakdown-in-talks headline is the fat tail that cracks the pin in a single tick. Two Fed voters speaking at 9:10 and 9:15 add open-bell noise with no data to anchor their framing, and the directional read under the surface shows technology lagging, with the technology-heavy index flat while the broad market and the Dow tick higher, a rotation worth confirming once internals go live after the open. Because today is the last trading Friday of May, month-end rebalancing flows concentrate into the 3:00 to 4:00 close, raising the odds of a mechanical, technical-agnostic move in the final hour.
Friday's calendar (ET). No PCE, CPI, or payrolls, so headlines and Fed voters carry the session.
The Trade: Two-Sided at the Record
This is prep framing, not a live entry. The confirmed setup fires at 9:45 ET once the opening range forms and internals are readable, and the read is genuinely two-sided, conditional on the 7,595.75 high. The continuation case wants a five-minute accept and hold above 7,595.75 with positive internals, entering near 7,598 on the retest, risking back to 7,586 below the overnight shelf, and targeting 7,610 then 7,624 at the call concentration, roughly a one-to-one then better than two-to-one. A rejection wick back under 7,588 voids it.
The bearish side has two flavors. Fading the extreme means selling a rejection at 7,595.75 on a lower-high near 7,593, risking just above the record at 7,598, and targeting the 7,572 shelf then 7,550, a favorable four-to-one or better if the fade works. The breakdown-continuation case is different: it waits for a loss of the 7,572 shelf on volume and a failed retest near 7,570, risking back above 7,582, and targeting 7,550 then the 7,525 to 7,515 trend zone. In both directions, a US-Iran deal headline or a hawkish Fed line at the open overrides the technical structure in real time, which is why none of these pre-position before 9:45.
The Four Paths
Put the pieces together and the session resolves into four scenarios with very different odds. The base case is a pin-and-chop grind capped by the 7,600 concentration and supported by the overnight shelf, a flat-to-slightly-positive day on cheap volatility and fading momentum. A clean break and hold above 7,595.75 on strong internals is the second case, carrying to 7,609 then 7,624. A rejection at the record on a lower-high is the divergence scenario, unwinding toward 7,550 then 7,525. And the air-pocket, a hard talks-failure or hawkish surprise that breaks 7,515, is the low-probability tail that opens the fib stack at 7,486, 7,467, and 7,446.
Friday session scenarios with assigned probabilities and target zones in the ES domain.
The full-session envelope spans three cases: a compressed 7,560 to 7,590 if the pin holds, the most-likely 7,553 to 7,623 one-ATR band, and a wider 7,530 to 7,660 only if an Iran headline drives a directional expansion either way. The actionable read does not need to pick one. Respect the uptrend, expect rotation rather than chase, and let the 7,595.75 high cast the deciding vote after the opening range forms. We publish our performance methodology openly so every read can be measured against what it claimed. As Thursday's pre-PCE read and last Friday's call-wall grind both showed, the pin holds right up until a headline gives the market permission to leave it.
The record is only as durable as the geopolitical calm beneath it.
Related reading: our risk-first guide to trading 0DTE SPY options, and Monday's record-highs-with-hedges read.
See how AlgoIndex translates this kind of read into systematic signals.
View pricing →Foundational guides
New to S&P 500 futures? Start with What Are ES Futures, the ES, NQ, MES & MNQ point value and contract specs, gamma exposure (GEX) explained, and market internals: TICK, ADD, VOLD and VIX.



