
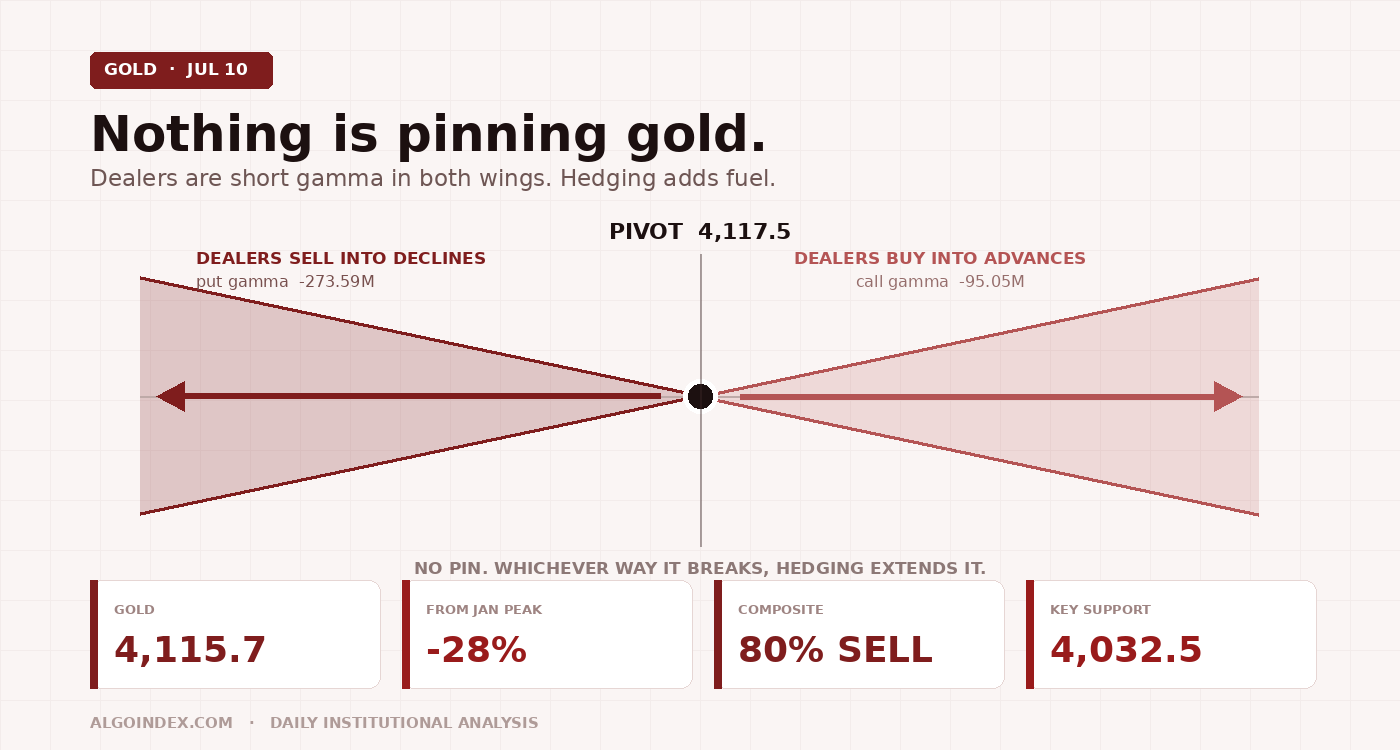
Gold is at 4,115.7, down 25.1 points or 0.61 percent, sitting almost exactly on its computed pivot at 4,117.5. It is falling against a weaker dollar and lower nominal yields, which means the marginal seller is a hedge liquidator, not a rates trader: mediators are restarting talks and the war premium is deflating in real time. Beneath the surface, dealers are short gamma in both wings, so hedging will amplify whichever way this resolves rather than dampen it. The plan: fade a morning rally into 4,138 to 4,155 with a 4,172 stop, targeting 4,103.0, 4,086.7 and 4,032.5. Be flat by the 13:30 settlement. Bearish, moderate conviction.
Gold should be up this morning. The dollar index is at 100.847, down 0.06 percent and posting a third consecutive losing session. The ten-year Treasury yield has eased two basis points to 4.53 percent. Taken alone, each of those inputs argues for a firmer metal. Gold is down 0.61 percent anyway.
When gold declines into a falling dollar and falling nominal yields, the person doing the selling is not expressing a view on rates. They are liquidating a hedge that is no longer needed. The United States struck roughly 90 Iranian military targets across a second consecutive day this week, and Iran retaliated against American bases in Bahrain, Kuwait and Qatar. Gold carried a safe-haven bid into that. Then, this morning, the headlines turned: Qatari negotiators are inside Iran, mediators are pulling both sides back, and there is a lull in the fighting. The war premium is coming out. That is the whole story of the overnight session, and it explains the divergence that nothing else does.
Ten of thirteen studies read sell. The three holds are all momentum-oscillator constructions, which is exactly what a counter-trend bounce produces. Trend signal: sell.
A rejection, not a consolidation
Thursday was an up day. Gold settled at 4,140.8 and the principal exchange-traded proxy closed 1.03 percent higher at 378.30 against a prior close of 374.45, on a straightforward safe-haven bid. Then the electronic session took it apart. Price opened at 4,135.4, already 5.4 points beneath settlement, tagged 4,144.6 in the early hours, a marginal 3.8-point extension that found no follow-through, and broke down through the entire prior-day balance to 4,103.0. The 41.6-point overnight range is roughly 40 percent of the 14-day average daily range of 104.1 points, so a meaningful portion of the day's expected movement has been spent without resolving anything. Volume of 32,693 contracts against open interest of 252,533 is appropriately light for the pre-open hour.
Read the shape of it. A failed 3.8-point poke above the prior settlement followed by a 41.6-point liquidation is a rejection. The 14-point reflex bounce off 4,103.0 back into the pivot is what reflex bounces look like, and it has been unable to sustain acceptance above 4,117.5. The forming daily candle shows an open at 4,135.4, a high at 4,144.6, a low at 4,103.0 and a current print of 4,115.7 to 4,117: trading in the lower third of the session range, beneath the open, beneath the prior settlement. Every one of those is bearish. The current hourly candle is an 8.7-point bar compressing directly on the pivot, open 4,113.8, high 4,121.8, low 4,113.1, close 4,117.3.
Three sessions ago, in our July 7 gold note, we wrote that the 20-day average had become the ceiling and that rallies into it were corrective. It is still the ceiling. It now sits at 4,157.2, and it is the exact upper boundary of today's fade zone.
The trend is not in question. The bounce is.
Gold peaked at 5,706.0 on January 29, 2026 and has since surrendered about 28 percent of its value. The 52-week low of 3,441.5 was set on August 1, 2025, and the entire distance from that low to that high was traversed in roughly five months. Price sits 28 percent beneath the high and 19.6 percent above the low. Three-month performance is negative 14.60 percent. It trades beneath the 5-day at 4,133.6 (0.4 percent below), the 20-day at 4,157.2 (1.0 percent), the 50-day at 4,403.4 (6.5 percent), the 100-day at 4,666.8 (11.8 percent), the 200-day at 4,556.7 (9.7 percent) and the year-to-date average at 4,722.4 (12.8 percent). The 50-day has fallen beneath both the 100-day and the 200-day, the ordering that confirms a medium-term downtrend. The 14-day directional index reads 37.23 with negative directional movement at 25.60 against positive at 12.89, nearly two to one, and the 9-day at 35.95 and 20-day at 33.71 say the trend has not decayed in the near term either.
And yet the one-month performance is a nearly flat negative 0.32 percent. Since the one-month low of 3,955.4 on June 30 and the one-month high of 4,403.6 on June 17, gold has been carving a wide, volatile, sideways range between roughly 3,955 and 4,404. The market is no longer in free-fall. It is attempting a high-volatility base inside a bear trend. Whether that base holds is a question for the coming weeks, not for today.
This week supplied the violence. It opened at 4,187.5, printed 4,215.5, then collapsed 183 points to 4,032.5 before recovering 85.4 points to the current 4,117 area. The short-dated oscillators have turned up hard off that washout, and the gradient is the message.
A market that fell far enough, fast enough, to exhaust its long-term momentum, now mean-reverting on the short end. The 9-day %D at 65.45 sits above the 9-day %K at 61.14, hinting that even the short-end reversion is starting to roll.
Relative strength offers no rescue. It reads 44.85 on the 9-day, 42.22 on the 14-day, 41.19 on the 20-day, 43.69 on the 50-day and 47.52 on the 100-day, all beneath the neutral 50 line but nowhere near oversold. The computed projections place the 14-day reading at 50 with a price of 4,232.9, at 30 with 3,825.0 and at 70 with 4,763.8. Gold would need to rally 117 points simply to restore a neutral momentum reading. There is no oversold-bounce argument to be made here.
Nothing is pinning this market
Gold futures carry no liquid dealer-positioning dataset of their own. The standard workaround is to read the profile of the principal exchange-traded fund, which carries a deep and actively hedged listed options market, and translate its levels back into futures terms. Against a gold futures reference of 4,116.3, the proxy's 378.30 close implies a translation multiplier of about 10.88 futures points per dollar of fund price. And what the proxy shows, dated today, is unusual.
Total estimated gamma notional across the visible strike range, 360 to 370, is negative. There is no pinning mechanism operating in gold's listed options complex today.
"Whichever direction this market resolves from the pivot, dealer hedging will add fuel rather than resistance. A break of 4,103.0 through 4,096.3 should be respected, not faded."
The rest of the proxy's readings reinforce it. Top gamma expiration is next Thursday, July 16, so the near-dated concentration is genuinely near-dated and will decay quickly; top delta expiration is November 29. Call volume of 97.18 thousand slightly exceeds put volume of 88.57 thousand, while the put-to-call open-interest ratio of 0.61 says the standing book carries considerably more call open interest than put. Options impact measures 4.64 percent. Two volatility-expansion thresholds are identified, an upper at 361 and a lower at 302 on the proxy, which translate to roughly 3,928 and 3,286 in futures terms. Both sit far beneath the current price. The nearest structural dealer level is nearly 190 futures points below spot. Price is free to travel between the technical levels without options-related obstruction.
A caution belongs here. This is an exchange-traded fund proxy for gold, not the gold futures contract itself, and the fund's options are hedged in fund shares rather than in COMEX futures. The translation is directionally informative and has historically tracked well, but it is an inference, and it should carry less weight in the decision than the price structure and the levels themselves.
One number corroborates the range work independently. The proxy's implied move is 5.76 dollars, which translates to roughly 62.7 futures points, or 1.52 percent. The overnight session has already consumed 41.6 of the 104.1-point 14-day average daily range, leaving about 62 points of expected expansion. Two unrelated methods landing on the same figure raises confidence in the band.
The specs bought the dip. The hedgers pressed the short.
| Category | Long | Short |
|---|---|---|
| Commercials | 59,118 (-5,461) | 280,188 (+10,205) |
| Non-commercials | 229,619 (+12,591) | 35,600 (-89) |
| Producers | 15,161 (-678) | 32,207 (+7,032) |
| Swap dealers | 25,821 (-1,917) | 229,845 (+6,039) |
| Managed money | 134,577 (+3,475) | 14,486 (-1,221) |
| Other reportables | 95,042 (+9,116) | 21,114 (+1,132) |
Managed money holds a net long of about 120,091 contracts and added into a market already down 28 percent from its high.
That divergence has one of two resolutions. Either the speculative accounts are right and gold has bottomed, or the crowded speculative long is an unresolved overhang that liquidates. Historically, when the commercial short is this large against a rising managed-money long during an established downtrend, the second outcome is the more common. It does not time anything. It does materially raise the probability that a break of 4,032.5 accelerates rather than bounces.
The precious complex offers no reason to think gold's decline is idiosyncratic. Silver trades at 60.075, down 1.11 percent, underperforming gold and lifting the gold-to-silver ratio to roughly 68.5. Palladium has been in a bearish trend since the January 2026 highs and broke beneath technical support in June. When the entire complex trends together off a common peak, the driver is macro, real rates and the dollar and the unwind of a crowded reflation trade, rather than anything specific to gold's own supply and demand. Elsewhere, the broad cash index trades near 7,543 with equity futures slipping 0.1 percent after chipmakers lifted the benchmark to its highest since mid-June, and the Nasdaq-100 is off 0.41 percent. The yen outperformed after the Japanese finance minister said the government wants pension funds to increase domestic allocations, and Japanese government bonds richened 5 to 11.5 basis points across the five-year and longer curve.
A quiet headwind, and a loud unscheduled risk
Beneath the friendly headline in rates sits a less friendly structure. Five-year yields are at local highs around 4.32 percent and the belly of the curve has cheapened notably. The front end has priced 44 basis points of tightening risk through March 2027. That is not an easing cycle being discounted; it is a hiking cycle being contemplated. With crude oil down 2 percent Thursday and inflation expectations easing, nominal yields holding at local highs implies real yields are firming, and firming real yields raise the opportunity cost of holding a non-yielding asset. That is the quiet, persistent structural headwind that has taken gold down 28 percent from its January peak, and it has not gone away. Money markets price only 7 basis points for the July meeting, so a hike this month requires a clear upside surprise in next week's inflation print.
The counterargument is official-sector demand, and it is a real one. Research published this morning argues that many negatives are already reflected in gold's price after the recent decline, that central banks continue to regard the metal as their primary instrument for reducing exposure to the dollar given attempts to use the currency as a policy weapon, and that official purchases should resume, particularly if the global energy shock keeps fading. It further notes that a return of concerns about fiscal dominance over the central bank would weigh on real rates and assist a recovery. All true, and all beside the point today. That bid has been present throughout the entire 28 percent decline and has not arrested it. Official-sector demand sets a long-run support base. It does not set intraday direction. It belongs in the position-sizing calculus, not in the entry trigger.
The headline sequence is what actually matters. At 07:13 and 07:16 Eastern, reports that Qatar is in talks with both Washington and Tehran and that mediators are attempting to pull both sides back from the brink. At 07:25, an Iranian statement that attacks on infrastructure will be answered in kind. At 08:13, the first six employees of the Bushehr nuclear plant beginning to return to work. At 08:14, confirmation that the talks aim to address implementation of the existing memorandum of understanding and the navigation disputes in the Strait of Hormuz. At 08:37, a headline describing a lull in the fighting as mediators try to restart talks. Reporting also indicates the strikes have failed to break Iranian control over the Strait. Energy markets have already voted: Brent fell 0.4 percent to around 76 dollars after a volatile week, and August crude trades near 71.84. Currency strategists observe that the escalation left developed-market currency volatility stuck at six-year lows, with investors apparently expecting tensions to subside. European equities are on track for their first weekly decline in five weeks as traders reduce risk ahead of the weekend.
Which cuts both ways, and the second edge is the one that governs risk. A truce that the market itself describes as fragile, over a weekend, with Hormuz navigation formally unresolved and mediators still shuttling, is precisely the configuration that produces protection buying into a Friday close. That is a recurring, structural bid in the final hours, and it argues against carrying a short into the bell. Gold's pit session runs 08:20 to 13:30 Eastern and the contract settles at 13:30, not at the 16:00 equity close, after which liquidity thins materially. Positions held past that point face a 65-hour weekend gap with no ability to manage.
The trade: sell the rally, not the low
Overhead, supply arrives in layers. The pivot at 4,117.5 is being tested from beneath right now. Immediately above sit the computed target price at 4,122.6 and the pair at 4,126.6 (the 38.2 percent retracement from the four-week low) and 4,127.5 (the 14-day %K stall point), three references inside five points forming the first real concentration of overhead supply. Then 4,140.8, Thursday's settlement and the most psychologically important number on the chart; reclaiming and holding it would neutralize the bearish overnight signature entirely. Then 4,144.6, the overnight high, where sellers first asserted themselves. Then 4,152.8, the 50 percent stochastic reference, and 4,157.2, the confluence of the 20-day average and the 18-day crossing, and the level above which sustained hourly acceptance means the search for shorts is over. Above that: 4,171.7 (first pivot resistance) sitting almost on top of 4,174.6 (one standard deviation), then 4,179.5 (50 percent retracement of the four-week span), 4,188.6 (two standard deviations), 4,202.5 (second pivot resistance), 4,215.5 (this week's high) and 4,256.7 (third pivot resistance, out of reach in a session).
Beneath, the immediate shelf is a tight grouping between 4,096 and 4,107: the one-standard-deviation support at 4,107.0, the 9-day average crossing at 4,104.2, the overnight low at 4,103.0 and the point at which that crossing stalls at 4,096.3. Four references inside eleven points. A decisive break of 4,103.0 through 4,096.3 is the trigger for the day's downside. Beneath it, 4,093.0 (two standard deviations) pairs with 4,086.7 (first pivot support) within seven points, and 4,082.2 is the three-standard-deviation support, making 4,082 to 4,093 the second shelf and the natural first objective for a sustained break. Below that: 4,073.8 (30 percent raw stochastic), 4,059.0 (where the 3-10-16 day moving-average convergence stalls), and 4,034.4 (20 percent raw stochastic) sitting directly on 4,032.5, which is simultaneously the second pivot support and this week's low. A computed projection landing within two points of the actual weekly low makes 4,032.5 the most important support on the chart and the line separating a corrective pullback from a resumption of the primary downtrend. Beneath it, 4,001.7 is the third pivot support and the round 4,000 handle, 3,955.4 is both the one-month and thirteen-week low set June 30, and a break there opens the 3,825.0 area where the 14-day relative strength would register 30.
The stop at 4,172 sits above the 4,171.7 first pivot resistance and beneath the 4,174.6 one-standard-deviation projection. It is structural: acceptance above the first pivot resistance means the fade thesis is wrong. Take partial profit at 4,103.0, which has already been defended once overnight. Target 2 at 4,086.7 sits inside the second shelf. Target 3 at 4,032.5 is a stretch requiring a genuine trend day and a fresh bearish catalyst, realistically a runner only. An hourly close above 4,157.2 closes the short regardless of whether the stop has been touched. And if price has not reached the entry zone by 12:00 Eastern, stand the setup down rather than chase it; the remaining window to the 13:30 settlement is insufficient to reach Target 2.
Any headline indicating re-escalation, a strike on Iranian energy infrastructure, a formal closure of the Strait of Hormuz, an Iranian attack producing American casualties, or a collapse of the Doha talks, closes the position immediately at market without waiting for the stop. Gold will gap on that news and the stop will not fill where it rests. This override supersedes every technical consideration on the page.
If price instead rejects the pivot at the open and breaks 4,103.0 without offering a rally, do not chase the break. Wait for a failed retest of the broken shelf from beneath: enter 4,103 to 4,110 on rejection, stop 4,122.6 above the computed target price and the pivot, targets 4,086.7 (roughly 1:1.1 from a 4,106 entry), 4,059.0 and 4,034.4 to 4,032.5, invalidated by a reclaim of and acceptance above 4,126.6. That structure carries a materially worse initial risk-to-reward than the primary, which is precisely why waiting for the rally is preferred; the conditional exists so the direct breakdown is not traded impulsively. The counter-trend long is the lowest-conviction expression of all and requires an hourly close above 4,157.2: entry 4,157 to 4,162, stop 4,138 beneath the prior settlement, targets 4,171.7, 4,188.6 and 4,202.5. Take it only in the presence of a genuine re-escalation headline. Absent that catalyst, a reclaim of 4,157.2 is a reason to stand aside, not a reason to buy into a downtrend against an 80 percent sell composite.
Path C most plausibly requires a re-escalation headline out of the Middle East and would arrive as a gap or an impulse rather than a grind. It invalidates the bearish thesis entirely.
Stand aside before 09:45 Eastern, without exception, and after 16:00, which in practice means no new entry after the 13:30 settlement. Stand aside if at 09:45 price remains trapped between 4,110 and 4,125 with no directional impulse and declining volume; the pivot is doing its job and the market has not chosen. Stand aside if a consequential headline has printed within the previous fifteen minutes; wait for the impulse to complete and a structure to re-form. Stand aside if, following the Canadian employment release and the dollar's reaction, gold has already traded down through 4,096.3 before 09:45; the move has occurred without us and the primary short is void. And do not initiate any new position after 13:00 that would be held into the weekend.
The war premium is leaving. The real-rate headwind never left. And with dealers short gamma in both wings, nothing is standing between price and the next level.
The complete data picture
Every level and reading from the morning GC review. Prices are COMEX gold futures unless a proxy construct is named. Nothing rounded away.
| Resistance (bottom to top) | Support (top to bottom) |
|---|---|
| 4,117.5 daily pivot (being tested from beneath) | 4,107.0 one-SD support; 4,104.2 9-day average crossing |
| 4,122.6 computed target price | 4,103.0 overnight low; 4,096.3 where the 9-day crossing stalls |
| 4,126.6 38.2 percent retracement from the four-week low; 4,127.5 14-day %K stall | 4,093.0 two-SD support; 4,086.7 first pivot support; 4,082.2 three-SD support |
| 4,140.8 prior settlement; 4,144.6 overnight high | 4,073.8 at the 30 percent raw stochastic; 4,059.0 where the 3-10-16 day convergence stalls |
| 4,152.8 50 percent stochastic reference; 4,157.2 20-day average and 18-day crossing (the confluence) | 4,034.4 at the 20 percent raw stochastic; 4,032.5 second pivot support and this week's low |
| 4,171.7 first pivot resistance; 4,174.6 one-SD; 4,179.5 50 percent retracement of the four-week span | 4,001.7 third pivot support and the 4,000 handle |
| 4,188.6 two-SD; 4,202.5 second pivot resistance; 4,215.5 this week's high; 4,256.7 third pivot resistance | 3,955.4 one-month and thirteen-week low (June 30); 3,825.0 where 14-day relative strength registers 30 |
| Period | Raw stoch | %K | %D | RSI | ATR (%) | ADR (%) |
|---|---|---|---|---|---|---|
| 9-day | 63.32% | 61.14% | 65.45% | 44.85 | 106.3 (2.60%) | 99.6 (2.42%) |
| 14-day | 58.24% | 44.51% | 41.63% | 42.22 | 111.6 (2.70%) | 104.1 (2.53%) |
| 20-day | 36.75% | 35.48% | 37.00% | 41.19 | 115.2 (2.80%) | 109.1 (2.65%) |
| 50-day | 19.07% | 18.41% | 19.72% | 43.69 | 123.9 (3.00%) | 109.5 (2.66%) |
| 100-day | 10.57% | 10.20% | 10.93% | 47.52 | 115.3 (2.80%) | 126.1 (3.06%) |
No pin, no cushion, and a war premium walking out the door.
See how AlgoIndex turns dealer positioning into systematic signals. Read today's S&P 500 note and today's Nasdaq note.
View pricing


