
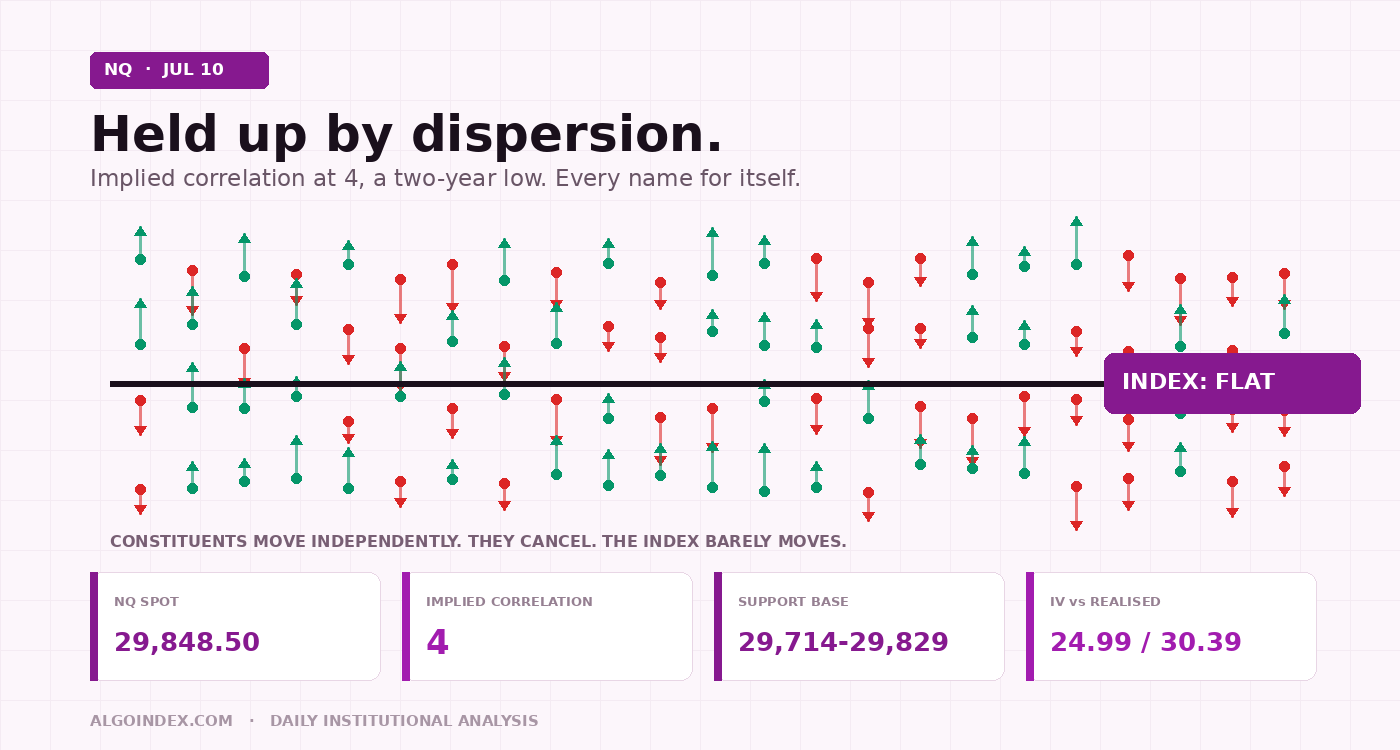
The Nasdaq-100 added roughly 1.6 percent Thursday on a semiconductor-led advance backed by the strongest single-name options positioning in thirty sessions. Overnight it gave 88.50 points back to 29,848.50, holding above its computed pivot the entire way down. Dealers are long gamma and will buy weakness into the 29,714 to 29,829 base, which contains six independent technical constructions. But one-month implied correlation has collapsed to about 4, a two-year low, so the index is held aloft by dispersion rather than by a broad bid. The plan: long 29,760 to 29,800 toward 29,911, 29,964 and 30,046. Two thirds of normal size. The reason is not the chart.
Four. That is the current reading on one-month implied correlation across the broad index, and it is the lowest in two years. It means the constituents of this index are moving independently, up here and down there, cancelling one another out, and the index's own volatility is being suppressed as a mathematical consequence. It is not a bid. It is an accounting identity. And it is what has been holding the Nasdaq-100 up all week.
This matters because of what a dispersion-supported market is good at and what it is bad at. It absorbs single-name shocks beautifully; one company breaks and the other ninety-nine shrug. It absorbs correlated macro shocks not at all, because when a catalyst forces every constituent to move the same direction at once, the cancellation stops and there is nothing beneath the index to catch it. Positive dealer gamma dampens such a move. It does not prevent one. There are two catalysts in front of this index that could do exactly that, and neither is on the economic calendar. Today's United States calendar is empty.
Conviction low to moderate, and capped by headline risk rather than by the technical picture.
A trend day, then a controlled give-back
Thursday settled at 29,937.00 after an advance of roughly 1.6 percent, the strongest expansion of leadership in a week that had otherwise been narrow and mean-reverting. The cash Nasdaq-100 matched it while the broad large-cap index added only 0.8 percent, and the semiconductor sector outpaced both with roughly 2.5 percent. The leading United States memory manufacturer rebounded 5 percent, reclaiming the 950 level that had capped it and orienting toward materially higher gamma concentration near 1,200. The broad volatility gauge closed at 15.86, up 0.06 or 0.38 percent, with the volatility-of-volatility measure near 89, a combination describing a market neither complacent nor defensive.
Then the electronic session took some of it back, carefully. NQ opened globex at 29,937.75, essentially unchanged, printed 29,964.25 and failed to extend, worked down to 29,717.25, and stabilised near 29,848.50, off 88.50 points or 0.30 percent. Volume of 80,202 contracts against open interest of 279,566 describes an orderly session, not a liquidation. The 247-point overnight range is about 34 percent of the contract's 14-day average daily range of 726.82 points, which means the overnight low has not been properly tested and ample range remains for the cash session.
One fact from the overnight matters more than the rest. Price held above the computed pivot at 29,775.17 through the entirety of the decline. It never traded beneath it. That is the single most useful thing the night produced, and it is the foundation of everything below.
Conviction money, and a composite that disagrees
Strongest reading of the trailing thirty sessions. Same-day call buying is noise, hedged and unwound by the close. Longer-dated calls force dealers to stay short and hedge dynamically for weeks, supplying a persistent bid.
Hold that against the technical scoreboard, which disagrees with it. The multi-indicator composite computes to 16 percent bullish overall, signal strength weak, signal direction average, trend signal hold. Short-term indicators average 20 percent bearish, medium-term 25 percent bullish, long-term 67 percent bullish. That gradient, bearish near term and bullish long term, is precisely what a healthy uptrend looks like during a pause. It is also precisely what the early stage of a top looks like. The distinction is resolved by whether 29,717 to 29,775 holds. Worth knowing: the composite read 32 percent bullish as recently as the prior session, so the near-term deterioration is one session old and shallow.
Momentum offers no edge at all. Relative strength reads 50.13 on the 9-day, 50.69 on the 14-day (down 0.70), 52.01 on the 20-day and 54.96 on the 50-day. Every lookback sits within five points of the 50 midline. The 14-day stochastic %K at 41.11 above a %D of 32.89 has turned up from a low reading without yet reaching the upper half of its range, which is an early-stage constructive configuration rather than an exhausted one. Trend strength is weak and tilted the other way: the directional index reads 19.80, 16.58, 14.60 and 9.32 across the four lookbacks, beneath the 20 threshold at all of them, with negative directional pressure exceeding positive at every horizon. There is no trend to trade in the conventional sense. This is the technical expression of a distribution phase.
The moving-average stack says the same in a different dialect. Spot is 128.50 points above the 5-day at 29,720.00, 133.74 above the 50-day at 29,714.76, 2,271.54 above the 100-day at 27,576.96 and 3,078.36 above the 200-day at 26,770.14. But it is 119.31 points beneath the 20-day at 29,967.81, which has flattened and converted from support into first overhead resistance. Decisively above every intermediate and long average, pinned beneath the short one. And the 5-day and 50-day have converged near 29,715 to 29,720, within four points of the overnight low. That is not coincidence. It is where systematic and discretionary support meet.
Six constructions, one hundred and fifteen points
Seven levels inside 115 points, with a pivot, two averages, a Fibonacci retracement, a momentum midline and the overnight low. Structures of that density do not usually give way on first contact.
Overhead, the mirror image. First resistance is thin and immediate: the 9-day average crosses at 29,870.56, twenty-two points from spot, effectively transacting through it; the 3-10 day crossover stalls at 29,887.39; the computed target price for the session is 29,911.28, a level derived from the prior day's range and settle that frequently acts as a first-hour magnet. The genuine defence is a tight grouping between 29,937 and 29,990: the prior close at 29,937.00, the 50 percent raw stochastic level at 29,938.88, the 18-day average stall at 29,954.75, the overnight high at 29,964.25, then the shelf where the 40-day at 29,982.53 and the 18-day at 29,987.52 sit essentially on top of one another beneath the psychological 30,000 handle. Four constructions inside fifty points. Treat it as a zone, not a line.
Beyond it, 30,046.28 is the 38.2 percent retracement from the four-week high and the first target implying genuine trend resumption. Then 30,155.33 (first pivot resistance) and 30,204.98 (one standard deviation from the five-day close). Should the market extend, 30,315.98 (two standard deviations) and 30,373.67 (second pivot resistance) stack almost on top of one another and coincide with the primary call-side gamma concentration at 30,325 and the options-derived magnet near 30,335. That confluence, roughly 30,315 to 30,375, is where a strong day should be expected to terminate. Further out sit 30,556.35, 30,753.83 (third pivot resistance), 30,975.50 (one-month high) and 31,100.00 (the 52-week and 13-week high). For context, the 14-day relative-strength reading would need to reach 70 to justify 33,310.95, which is to say those extensions are not in play on any horizon relevant to today.
The observation worth carrying into the session is that supports arrive in tightly-spaced pairs all the way down. Beneath the base, 29,669.02 (one standard deviation) meets 29,659.61 (the 3-10-16 day convergence stall). Break 29,660 and 29,558.02 (two standard deviations) arrives with 29,556.83 (first pivot support), then 29,527.22 at the 30 percent raw stochastic. Deeper, 29,472.84 (three standard deviations) coincides almost exactly with 29,472.21 (38.2 percent retracement from the four-week low), then 29,435.00 (40-day stall), 29,368.25 (9-day stall), 29,321.40 (20 percent raw stochastic), and the second and third pivot supports at 29,176.67 and 28,958.33, with the one-month low at 28,543.00 the last defence before the intermediate structure is genuinely damaged. That is the topography of a market with buyers stacked beneath it, not one with air beneath it.
The two things nobody has priced
The South Korean memory producer that drove Thursday's advance debuts in the United States today. Depositary receipts more than seven times oversubscribed, indicated near 149 dollars, raising roughly 24.5 billion dollars, the second-largest such offering by a foreign company. The top ten accounts absorbed nearly half the receipts, concentrating the aftermarket float. No scheduled time; it crosses when the designated market maker opens it, typically inside the first ninety minutes.
Iranian state media reported Thursday that a military site near Bushehr was struck and a Navy site at Konarak attacked. Two tanker incidents in the Strait of Hormuz on July 7. Between 07:13 and 08:14 ET, reporting confirmed Qatari negotiators are in Iran, coordinating with Washington, to de-escalate and resolve the Hormuz navigation disputes.
"Traders should not read the calm as confirmation that the risk is absent. They should read it as confirmation that the risk is unhedged."
Consider what is missing from the cross-asset complex. There is an active armed exchange adjacent to the world's most important oil chokepoint, with tankers already struck, and there is no flight-to-quality signature anywhere. Crude sits at 72.19 dollars, firmer by 0.15 percent. Gold is softer by 0.63 percent at 4,114.8. Silver is down 1.60 percent. Bitcoin is up 1.93 percent and ether up 3.06 percent, consistent with risk appetite intact rather than defensive. The broad-index futures contract sits at 7,590.00, firmer by 1.25 points; the small-cap contract at 3,007.1 is softer by 0.04 percent; the blue-chip contract at 52,862 is firmer by 0.19 percent. Nothing anywhere carries a premium for mediation failure. Which is the point: the risk is not absent, it is uninsured, and the single-digit implied volatilities on Monday and Tuesday broad-index expiries make insuring it unusually cheap.
The rates backdrop is marginally supportive and structurally uncomfortable. The dollar index sits at 100.827, softer by 0.11 percent, and the ten-year yield has eased to 4.535 percent, down 1.4 basis points or 0.31 percent. Both remove a headwind from the most rate-sensitive of the major benchmarks rather than supplying a tailwind. But policy is not benign. The committee minutes released July 8 did not dislodge anything, yet as recently as June 17 nine of eighteen participants penciled in a rate hike for 2026, and the July 2 payroll print came in at 57,000 against a forecast of 113,000 with the prior revised down from 172,000 to 129,000. A decelerating labour market against above-target inflation is the configuration in which a committee is least able to help. The overnight financing rate eased to 3.53 percent for July 9 from 3.58 percent, and money-market fund assets rose to a record 7.953 trillion dollars, a reminder of how much cash sits waiting for a reason. Between now and Tuesday's inflation print, rate volatility stays suppressed and index behaviour is governed by positioning and hedging mechanics. That is the environment in which mean reversion dominates and breakouts fail. It is also the environment that ends abruptly on the print.
Dealers are long gamma, and the proxy's map is one day stale
In the cash index, the primary call-side gamma concentration sits at 30,325, the primary put-side at 28,000, the volatility inflection level at 29,075, the primary gamma concentration strike at 30,000 and the dealer gamma flip level at 28,742. The call-to-put gamma ratio reads 1.268, the only positive tilt among the major indices measured, with net gamma notional a modest positive 6.733 million dollars. Key strike interest groups at 30,000, 30,325, 28,000 and 29,000, and the options-derived magnets sit at 28,785, 28,989, 30,013 and 30,335. Read directly: the index is trading roughly 780 points above its volatility inflection level and roughly 1,100 points above its gamma flip level. Dealers are long gamma. Long-gamma dealers sell strength and buy weakness. That is the mechanical source of the dip-supported behaviour observed all week, and it persists today unless the index breaks decisively beneath 29,075, which is not a realistic single-session outcome absent a shock.
A caveat that matters. These proxy levels were computed against a reference price of 711 dollars in the exchange-traded fund, and the fund closed Thursday at 722.80, up 1.60 percent from a prior close of 711.44. It has therefore traded through its stated call-side gamma concentration at 711, through its volatility inflection level at 710, and through its dealer gamma flip level at 715. Those levels are stale by one session and reset higher on today's computation. The operationally reliable figure is the high volatility point at 716 dollars, which now sits beneath spot and converts from resistance into the first dealer-relevant support in the proxy. With put gamma of negative 1.84 billion dollars against call gamma of negative 259.56 million, and a put-to-call open-interest ratio of 1.34, put-side exposure dominates by a factor of seven. A proxy trade beneath 716, roughly equivalent to a cash index near 29,400, marks the transition from dealer stabilisation to dealer amplification. Note the low volatility point at 500.00, far beneath anything relevant.
Implied runs 5.4 volatility points beneath realised, yet sits in the upper third of its own one-year history. Both are true: realised has expanded faster than implied has followed. The options-implied one-day move in the proxy is 11.22 dollars, about 1.55 percent, which scales to roughly 460 index points.
The trade: buy the base, sell the prior close
Long. Enter 29,760 to 29,800 on a retest of the support base after the opening range completes, requiring a fifteen-minute candle to trade into the zone and close back above 29,800. No entry before 09:45 Eastern. The opening fifteen minutes exist to establish the range, not to be traded; expect a 90 to 160 point opening range given typical first-quarter-hour participation of 15 to 20 percent of the session's eventual excursion.
The stop at 29,660 is structural, beneath the 29,669.02 one-standard-deviation support and the 29,659.61 convergence, and therefore beneath the entire base rather than inside it. Target 1 at 29,911 is the computed target price and a first-hour magnet; take a third. Target 2 at 29,964 is the overnight high, sitting immediately above the prior close at 29,937 and beneath the 29,982 to 29,990 shelf; take a second third. Target 3 at 30,046 is the 38.2 percent retracement from the four-week high, the first level implying genuine trend resumption. Reclaiming 29,937 and holding it for two consecutive fifteen-minute closes is the session's first genuine tell: it puts 29,982 to 29,990 in play and, through that shelf, 30,000 and then 30,046. Rejected at 29,937 on the first attempt, which is the modal outcome in positive gamma, the market rotates back to the base and the day resolves as rotation.
Two macro overrides, either sufficient. First, a failed listing debut, defined as the new receipts trading beneath their 149 dollar indicated issue price within the first hour, negates the constructive case for the sector that carried Thursday's advance; do not initiate, and exit any existing position on a break of the entry zone rather than waiting for the stop. Second, any headline indicating the Qatari mediation has collapsed, or any report of a fresh strike or a vessel struck in the Strait of Hormuz, voids the setup entirely. Exit at market on the headline. Do not wait for a level. Sizing is reduced to two thirds not because the technical setup is poor but because an unscheduled tail cannot be timed and the market carries no protection against it.
The conditional short exists only after a fifteen-minute close beneath 29,717.25, which would print the first lower low of this leg. Enter 29,700 to 29,730 on a retest of the broken low from beneath; chasing the initial break is prohibited. Stop 29,790, above the pivot and the relative-strength midline, risking 75 points from a 29,715 entry. Target 1 at 29,669 (one standard deviation, 46 points) is a scale point only and is not worth taking in isolation. Target 2 at 29,558, the paired second-standard-deviation and first-pivot support, is the primary objective at 157 points. Target 3 at 29,475, the paired third-standard-deviation and 38.2 percent four-week-low retracement, offers 240 points. That is roughly 1:0.6, 1:2.1 and 1:3.2. Any reclaim of 29,775 on a fifteen-minute close invalidates it. This short is taken against positive dealer gamma, meaning dealer hedging works against it the whole way down: size at half the primary allocation, take profits mechanically, and do not hold into the afternoon expecting acceleration.
Stand aside entirely if the 09:30 to 09:45 opening range exceeds 200 points, which implies a headline-driven session against which every level here was computed. Stand aside if price oscillates between 29,800 and 29,900 through 10:30 without directional intent, because the entry zone will never be reached and forcing an entry above it destroys the risk-to-reward that justifies the trade. Stand aside if the listing debut produces erratic two-sided movement, defined as the new issue trading a range exceeding 15 percent of its issue price within its first thirty minutes. Stand aside on any headline indicating escalation rather than de-escalation, and do not attempt to trade the first thirty minutes of a geopolitical repricing on levels computed before it. And stop trading after two stops; that is the daily limit.
A geopolitical trigger under Path C would likely overshoot these levels rather than respect them, because the correlated bid that normally absorbs such moves does not currently exist.
One last operational note. Today is a monthly-cycle expiry Friday in a number of single names, including the memory manufacturer whose Thursday flow was concentrated in contracts expiring today. That flow is transient and its supportive effect on the sector decays through the morning rather than persisting. Do not read Thursday's single-name strength there as durable positioning of the same character as the broader longer-dated call buying. Take profits on any long into the late morning rather than holding for a close. Be flat, or scaled down, well ahead of 16:00 Eastern.
An index held aloft by dispersion is stable until every constituent is told to move the same way at once. That instruction arrives Tuesday at 08:30.
The complete data picture
Every level and reading from the morning NQ review. All prices are NQ futures prices unless a cash-index or proxy construct is named. Nothing rounded away.
| Resistance (top to bottom) | Support (top to bottom) |
|---|---|
| 31,100.00 52-week and 13-week high; 30,975.50 one-month high | 29,828.52 18-40 day moving-average crossing |
| 30,753.83 third pivot resistance; 30,556.35 | 29,786.10 14-day relative-strength midline |
| 30,373.67 second pivot resistance; 30,315.98 two SD; cash call-side gamma concentration 30,325; magnet 30,335 | 29,775.17 computed pivot (held all night) |
| 30,204.98 one SD; 30,155.33 first pivot resistance | 29,759.25 50 percent four-week retracement |
| 30,046.28 38.2 percent retracement from four-week high | 29,720.00 5-day average; 29,717.25 overnight low; 29,714.76 50-day average |
| 29,987.52 18-day average; 29,982.53 40-day average (the shelf); 30,000 handle and cash gamma concentration strike | 29,669.02 one SD support; 29,659.61 3-10-16 day convergence stall |
| 29,964.25 overnight high; 29,954.75 18-day stall; 29,938.88 50 percent raw stochastic; 29,937.00 prior close | 29,558.02 two SD; 29,556.83 first pivot support; 29,527.22 at 30 percent raw stochastic |
| 29,911.28 computed target price; 29,887.39 3-10 day crossover stall; 29,870.56 9-day average crossing | 29,472.84 three SD; 29,472.21 38.2 percent from four-week low; 29,435.00 40-day stall; 29,368.25 9-day stall; 29,321.40 at 20 percent raw stochastic; 29,176.67 and 28,958.33 pivot supports; 28,543.00 one-month low |
| Period | RSI | Raw stoch | %K | %D | ADX | +DI | -DI |
|---|---|---|---|---|---|---|---|
| 9-day | 50.13 | 56.35% | 50.06 | 39.98 | 19.80 | 17.04 | 22.62 |
| 14-day | 50.69 (down 0.70) | 46.27% | 41.11 | 32.89 | 16.58 | 17.66 | 22.15 |
| 20-day | 52.01 | 54.22% | 50.15 | 46.14 | 14.60 | 18.66 | 21.70 |
| 50-day | 54.96 | n/a | n/a | n/a | 9.32 | 21.20 | 21.75 |
Dispersion is holding this index up. Dispersion is not a bid.
See how AlgoIndex turns positioning into systematic signals. Read today's S&P 500 note and the pillar on gold note, and the pillar on how dealer call and put walls behave.
View pricing


