
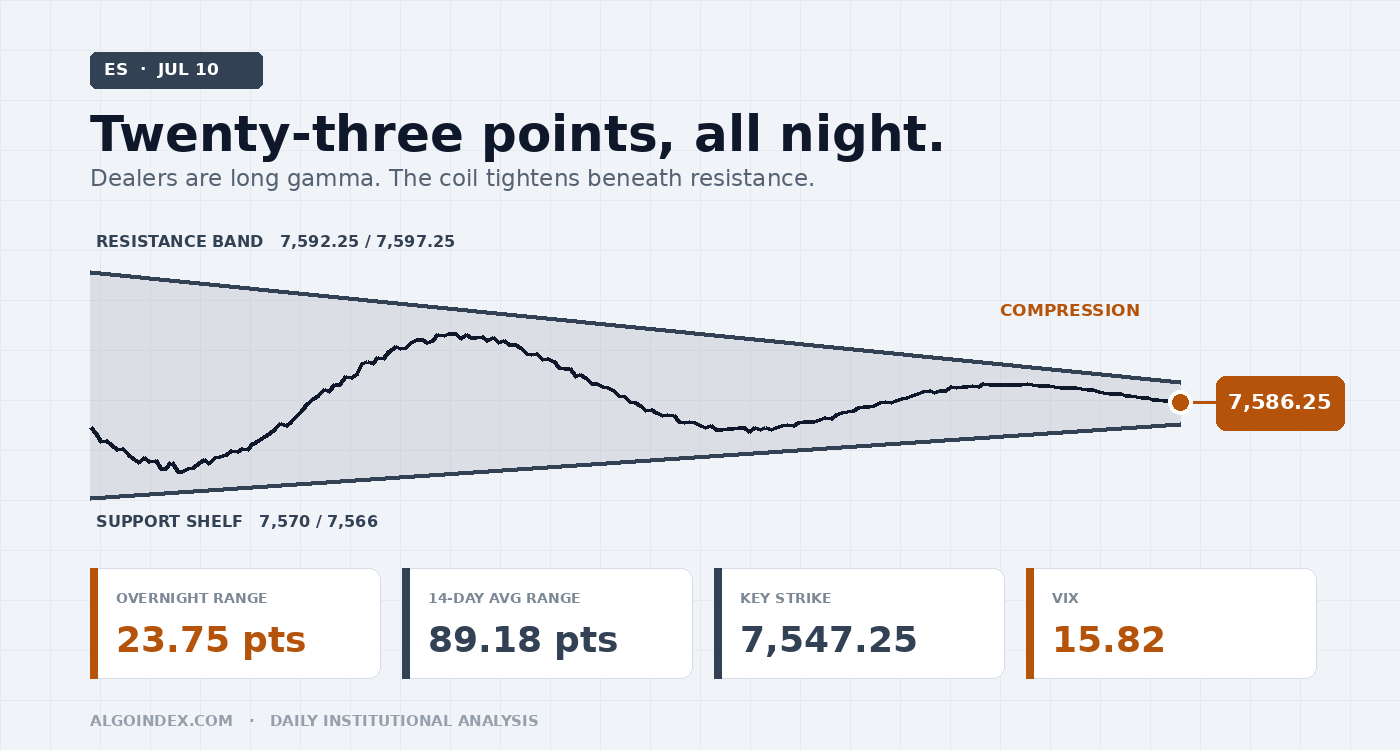
ES sits at 7,586.25 after an overnight session that travelled 23.75 points, roughly a quarter of a normal day, and it did that compressing directly beneath resistance rather than above it. Dealers are long gamma across every nearby strike, which buys weakness and sells strength. Meanwhile index volatility has been crushed, at-the-money implied in the low teens and Monday near 8 percent, into a week carrying two inflation prints, retail sales, monthly expiration and the Fed chair's testimony. The plan: long the 7,566 to 7,570 shelf toward 7,592, 7,597 and 7,616. Bias neutral with a modest upward drift, conviction low to moderate.
Twenty-three and three-quarter points. That is the entire distance ES travelled overnight, against a fourteen-day average daily range of 89.18. The contract opened the electronic session at 7,587.25, printed 7,592.25, dipped to 7,568.50, and has spent the balance of the night doing almost nothing at 7,586.25. Volume near 136,000 contracts. A one-hour bar that opened 7,583.50 and last traded 7,586.25, a gain of four one-hundredths of one percent.
That compression is the session. It is happening beneath a dense band of resistance, not above it, and it is happening because dealer positioning is net long gamma across every nearby strike. Hedgers buy weakness and sell strength; realized movement dies. In Thursday's note we said the positive-gamma pin would keep buying dips. It never offered one. The market ran instead, chip-led, to a 7,588.75 settle. Today the same mechanic points the other way: price is sitting inside the heaviest part of the hedge book, which is exactly where movement goes to die.
A consolidation, not a statement
The whole overnight session consumed about 27 percent of a normal day's expected movement.
Thursday's regular session was a genuine advance. The E-mini added 0.82 percent, the cash index closed up 0.81 percent at 7,541.50 against a prior close of 7,482.71, and the Nasdaq-100 outpaced both at plus 1.62 percent. But the leadership was narrow and identifiable: a semiconductor rally, catalyzed by a South Korean memory maker's American depositary receipts, did the work, while the Dow added only 0.27 percent. A 1.62 percent Nasdaq-100 gain against a 0.27 percent Dow gain is a spread of 135 basis points in one session. That is not a broad advance. That is a rotation into duration and semiconductors, financed by everything else. The market enters Friday with the index level of a trending market and the internal composition of a rotational one.
Price sits above every moving average of consequence, the 5-day at 7,568.70, the 20-day at 7,521.45, the 50-day at 7,504.42, the 100-day at 7,200.64 and the 200-day at 7,091.72, in perfect ascending order. The contract is up 8.44 percent year to date and 10.33 percent above its 200-day. Note the compression between the 20-day and the 50-day, separated by only 17 points, about a fifth of a daily range. That is a compressing signature on the daily chart, and it says the intermediate trend has flattened even as the long-term trend remains firmly higher. Location matters more than the trend label here: the 52-week high is 7,693.75 and price is 1.44 percent beneath it, with the one-month high at 7,648.75 and the one-month low at 7,292.25 placing the current print at roughly 83 percent of the monthly range.
The five-day change of plus 55.00 points (0.73 percent) says the recent advance has been slow. The twenty-day change of plus 244.50 points (3.33 percent) says it has been persistent. Persistent but decelerating is the signature of a market approaching a level it does not want to clear without new information, and each successive advance since the one-month high has covered less ground and retraced more of itself. Price is compressing beneath cash 7,600, which is 7,647 in the futures domain, rather than driving through it.
The momentum picture carries the session's most interesting tension. Relative strength sits in the mid-fifties across every lookback, 57.45 on the 9-day, 55.74 on the 14-day, 55.71 on the 20-day, 56.11 on the 50-day, which is the definition of neutral; the 14-day would need price at 7,876.09 to reach 70 and 7,510.71 to fall to 50. Both are distant. The stochastics tell a different story, the 14-day raw at 92.15 percent and the 9-day at 90.59 percent placing price in the top decile of its recent range. Elevated stochastics in a positive-positioning environment are not a short signal; they say upside from here needs new buyers rather than mechanical hedging flow. And the directional measures lean negative at every lookback, the 14-day directional index at 18.18 beneath the 20 threshold with negative directional movement exceeding positive from nine days through one hundred. Price is above every average while the directional measures lean down. That is a market carried higher by hedging flow and passive demand, not by aggressive directional buying.
Price is sitting inside the hedge book
Dealer positioning is net long gamma across all nearby strikes, and single stocks in aggregate carry positive gamma too. The dealer positioning index reads 3.393, firmly positive; call-side gamma exposure stands at 6.79 billion against put-side of negative 2.53 billion. The mechanical consequence is unambiguous: hedgers buy weakness and sell strength, realized movement is suppressed, and price is drawn toward the strike of greatest concentration. That strike is cash 7,500, futures 7,547.25, thirty-nine points beneath the current reference and identified in this morning's research as the key strike and today's support.
| Cash strike | Reading | Futures | Character |
|---|---|---|---|
| 7,596 | 99.81 | 7,643 | Densest on the board |
| 7,551 | 99.38 | 7,598 | Support pair with the 2-SD band |
| 7,574 | 99.27 | 7,621 | Overhead |
| 7,627 | 99.08 | 7,674 | Coincides with the 2-SD band |
| 7,619 | 97.15 | 7,666 | Upper shelf |
| 7,559 | 97.52 | 7,606 | Just above spot |
The low volatility point sits at cash 7,565 and the high at cash 7,710. Price is beneath the low point, so suppression is running near full strength.
The volatility inflection level is cash 7,495, futures 7,542.25. Above it, dealer hedging dampens movement; below it, hedging amplifies it. The distance between the concentration strike at 7,547.25 and that inflection is five points in the futures domain, so the support architecture beneath price is dense but the transition beneath it is abrupt. The dealer gamma flip level sits lower still at cash 7,443, futures 7,490.25, and the pivot separating constructive from defensive positioning is cash 7,440, futures 7,487.25. Resistance is layered in the options domain at cash 7,550, 7,575 and 7,600, mapping to futures 7,597.25, 7,622.25 and 7,647.25, with cash 7,600 flagged as major resistance likely to hold into next week. The lower put-concentration strike is far away at cash 7,300, futures 7,347.25, which tells you the downside hedge is positioned for a move considerably larger than anything the current surface prices.
Volatility is priced for a week that does not exist
Implied-volatility rank 20.05 percent, skew rank 52.57 percent, one-month implied correlation beneath 8 at two-year lows.
"The S&P complex is priced for tranquility while the technology complex is priced for movement, and technology is a third of the S&P by weight. That disconnect is not sustainable indefinitely."
The volatility index sits at 15.82, up 0.13 percent, back at one-month lows. One-month realized on the cash index is 14.85 percent against one-month implied of 13.45 percent. Five-day realized on the cash index is roughly 8 percent, so the front of the curve is priced consistently with the recent past and inconsistently with the coming calendar. The dispersion against the Nasdaq is stark: Nasdaq-100 five-day realized volatility is roughly 22 percent and the Nasdaq exchange-traded proxy shows implied in the twenties. Meanwhile one-month implied correlation sits beneath 8 at two-year lows. Correlation that low means constituents move independently, idiosyncratic moves offset in aggregate, and index volatility is suppressed mechanically. That is exactly why the index complex has been crushed while single-name implied volatility, supported by approaching earnings, has not.
Low correlation is a benign condition until it is not. When positioning shifts, and monthly expiration on July 17 is the natural occasion, correlation can normalize abruptly. A move from beneath 8 toward the twenties would be enough to open the door to a drawdown larger than anything the current surface contemplates. That risk is next week's, not today's, and it is the reason to own longer-dated index downside rather than sell premium here. Being short S&P index options at these levels offers poor compensation for the risk assumed.
A hiking debate, a record listing, and a negotiation in Tehran
The policy backdrop is unusual, and it is why index volatility deserves more respect than it is getting. The Fed is not being priced for accommodation. Sell-side research this morning describes an inflation impulse driven by artificial-intelligence capital investment and frames the central question of next week's congressional testimony from Chair Kevin Warsh as whether the committee should look through that impulse or respond to it. The phrase in circulation is pressure to hike. The secured overnight financing rate printed 3.53 percent for July 9 against 3.58 percent for July 8, a five basis point easing that says there is no stress in the plumbing. June inflation, due Tuesday, is expected to decelerate sharply, headline to 3.8 percent year over year from 4.2 percent with the month-over-month figure at negative 0.1 percent against a prior positive 0.5 percent, and core at 2.8 percent. A print confirming that would be received well. A print that does not would arrive into an index options complex carrying at-the-money implied volatility near 10 percent. There are no Fed speakers today; Governors Bowman and Waller both speak Monday.
The day's only genuine single-name catalyst is concentrated rather than diffuse. The South Korean memory producer whose depositary receipts drove Thursday's advance begins trading in the United States today, in what is characterized as the largest first-time foreign listing ever executed. A listing of that scale creates mechanical index-inclusion demand, arbitrage flow, and a visible print the semiconductor complex will trade around at the open. For an S&P futures trader that is second-order: if it prints well and semiconductors extend, the index inherits a modest bid; if it disappoints, a modest drag. Neither should be sufficient to clear 7,647 or break 7,542. Earnings season proper begins Wednesday with a major asset manager, a pharmaceutical major and an investment bank. Nothing reports today.
The Middle East moved overnight, and it moved toward de-escalation. At 07:16 Eastern, reporting indicated Qatar was in talks with both the United States and Iran. At 08:13, sources said Qatari negotiators are physically in Iran meeting Iranian officials to de-escalate and create conditions for broader negotiations, coordinated with Washington. At 08:14, further sourcing clarified the talks address implementation of the United States-Iran memorandum of understanding and the disputes that triggered the recent escalation, specifically including navigation rights in the Strait of Hormuz. The context is adversarial: on July 8 the president said in substance that he considered the memorandum finished, though he did not repeat that language at the NATO summit, and on July 7 a maritime authority reported a further tanker incident in the strait. Crude fell Thursday, consistent with the de-escalation read. The headline path is bidirectional and fast, and it is the single mechanism by which a compressed, positive-positioning Friday can violently expand. The correct posture is not to trade the headlines but to size for the possibility of them. Elsewhere, developed-market currency volatility sits at six-year lows with carry strategies at record performance highs, and the Swiss franc has reached decade highs against both the euro and the dollar on sustained haven demand, the one cross-asset signal that does not fit the tranquil narrative.
The trade: buy the three-method shelf
Three independent methods converge on one shelf. The overnight low at 7,568.50, the five-day mean at 7,568.70, and the daily pivot at 7,566.67 sit within two points of one another. Beneath that convergence lie two further layers, the 7,550 to 7,551 pair (a 99.38 concentration reading against the two-standard-deviation band at 7,549.80) and the primary gamma concentration strike at 7,547.25. Three layers of support inside twenty points, in an environment where dealers mechanically defend them, with no scheduled United States catalyst to force a break and a headline path running toward de-escalation. Buy 7,566.00 to 7,570.00 on a retest that holds, requiring a rejection wick or a fifteen-minute close back above 7,570. Never before 09:45 Eastern.
Stop 7,545.00, structural, beneath the 7,550 to 7,551 pair and beneath the concentration strike, while remaining above the volatility inflection at 7,542.25. Harvest a third at 7,592.25, the overnight high and first mechanical obstacle, about 24 points and roughly 1:1. Harvest a further third at 7,597.25, cash 7,550, the first dealer-positioning resistance and the most likely cap on an opening drive, about 29 points and roughly 1:1.3. Harvest the balance at 7,616.50, where the first pivot resistance at 7,617.08 meets the one-standard-deviation band at 7,616.29, about 48 points and roughly 1:2.1. Any headline indicating a breakdown in the Qatari-mediated negotiations, particularly one touching Hormuz navigation rights, voids the setup immediately regardless of price location. Crude will move first. Flatten and reassess. A confirmed de-escalation announcement argues for holding the full position to the third target rather than scaling.
The conditional short is low probability and requires Path B in its stronger form. Trigger only if price reaches 7,645.00 to 7,648.00 and produces a fifteen-minute rejection, a zone containing the second pivot resistance at 7,645.42, the upper call-concentration strike at 7,647.25, and the one-month high at 7,648.75. Enter 7,645 to 7,648 on rejection, stop 7,662.00, targets 7,622.25 and 7,597.25, risk about 16 points against 24 and 49 points of reward, roughly 1:1.5 and 1:3.1. Reaching that zone today would require a 60-point catalyst-free advance into the heaviest upside concentration in an environment where dealers sell strength; such an advance is being distributed as it happens. Do not force it. And stand aside entirely if the opening range exceeds 28 points, if ES opens beneath 7,547.25 or trades beneath it before 10:00, on any Hormuz escalation or formal breakdown of the negotiations, if ES has already traded above 7,600.00 before 09:45, if the semiconductor listing gaps materially lower at the cash open, or outside the 09:45 to 16:00 window.
Four scheduled first-tier events and an expiration inside five sessions, against at-the-money implied volatility in the low teens.
Under Path C the next meaningful support is 7,497.25 and the average-true-range assumption in this piece must be discarded.
The market is pricing near-perfection into a calendar that does not deserve it. That bill comes due next week, not today.
The complete data picture
Every level and reading from the morning ES review. Levels in the futures domain with cash-index equivalents in parentheses; the operative offset is plus 47.25 points (futures 7,590.25 against cash 7,543.00). Nothing rounded away.
| Resistance (top to bottom) | Support (top to bottom) |
|---|---|
| 7,693.75 52-week high; 7,695.83 third pivot resistance | 7,566 to 7,569 (cash 7,519 to 7,522): overnight low 7,568.50, 5-day 7,568.70, daily pivot 7,566.67 |
| 7,648.75 one-month high | 7,561.21 one-SD support |
| 7,647.25 (cash 7,600) upper call-concentration strike; 7,645.42 second pivot resistance | 7,550 to 7,551 (cash 7,504): 99.38 concentration, two-SD band 7,549.80 |
| 7,636.45 three-SD; 7,627.70 two-SD (99.08 at cash 7,627) | 7,547.25 (cash 7,500) primary gamma concentration strike |
| 7,622.25 (cash 7,575) second dealer-positioning resistance | 7,542.25 (cash 7,495) volatility inflection level; 7,541.05 three-SD support |
| 7,616 to 7,617: one-SD 7,616.29, first pivot 7,617.08 (cash 7,569 to 7,570) | 7,538.33 first pivot support |
| 7,597.25 (cash 7,550) first dealer-positioning resistance; 7,596 (cash 7,549) densest concentration 99.81 | 7,497.25 (cash 7,450) dealer support; 7,490.25 (cash 7,443) gamma flip; 7,487.92 second pivot; 7,487.25 (cash 7,440) pivot |
| 7,592.25 overnight high | 7,459.58 third pivot; 7,447.25 (cash 7,400) lowest dealer support; 7,347.25 (cash 7,300) lower put concentration; 7,292.25 one-month low |
| Period | Raw stoch | %K | %D | RSI | ADX | +DI | -DI | Hist vol |
|---|---|---|---|---|---|---|---|---|
| 9-day | 90.59% | 84.97% | 82.54% | 57.45 | 19.37 | 14.94 | 19.12 | 9.29% |
| 14-day | 92.15% | 84.58% | 77.96% | 55.74 | 18.18 | 15.48 | 19.79 | 10.46% |
| 20-day | 81.63% | 77.05% | 75.03% | 55.71 | 14.75 | 16.43 | 20.00 | 13.38% |
| 50-day | 78.19% | 74.97% | 73.84% | 56.11 | 9.46 | 18.88 | 21.29 | 13.13% |
A consolidation beneath resistance, and a volatility surface that has stopped believing in surprises.
See how AlgoIndex turns this kind of read into systematic signals. Read today's Nasdaq note and the pillar on gold note, and the pillar on how dealer call and put walls behave.
View pricing


