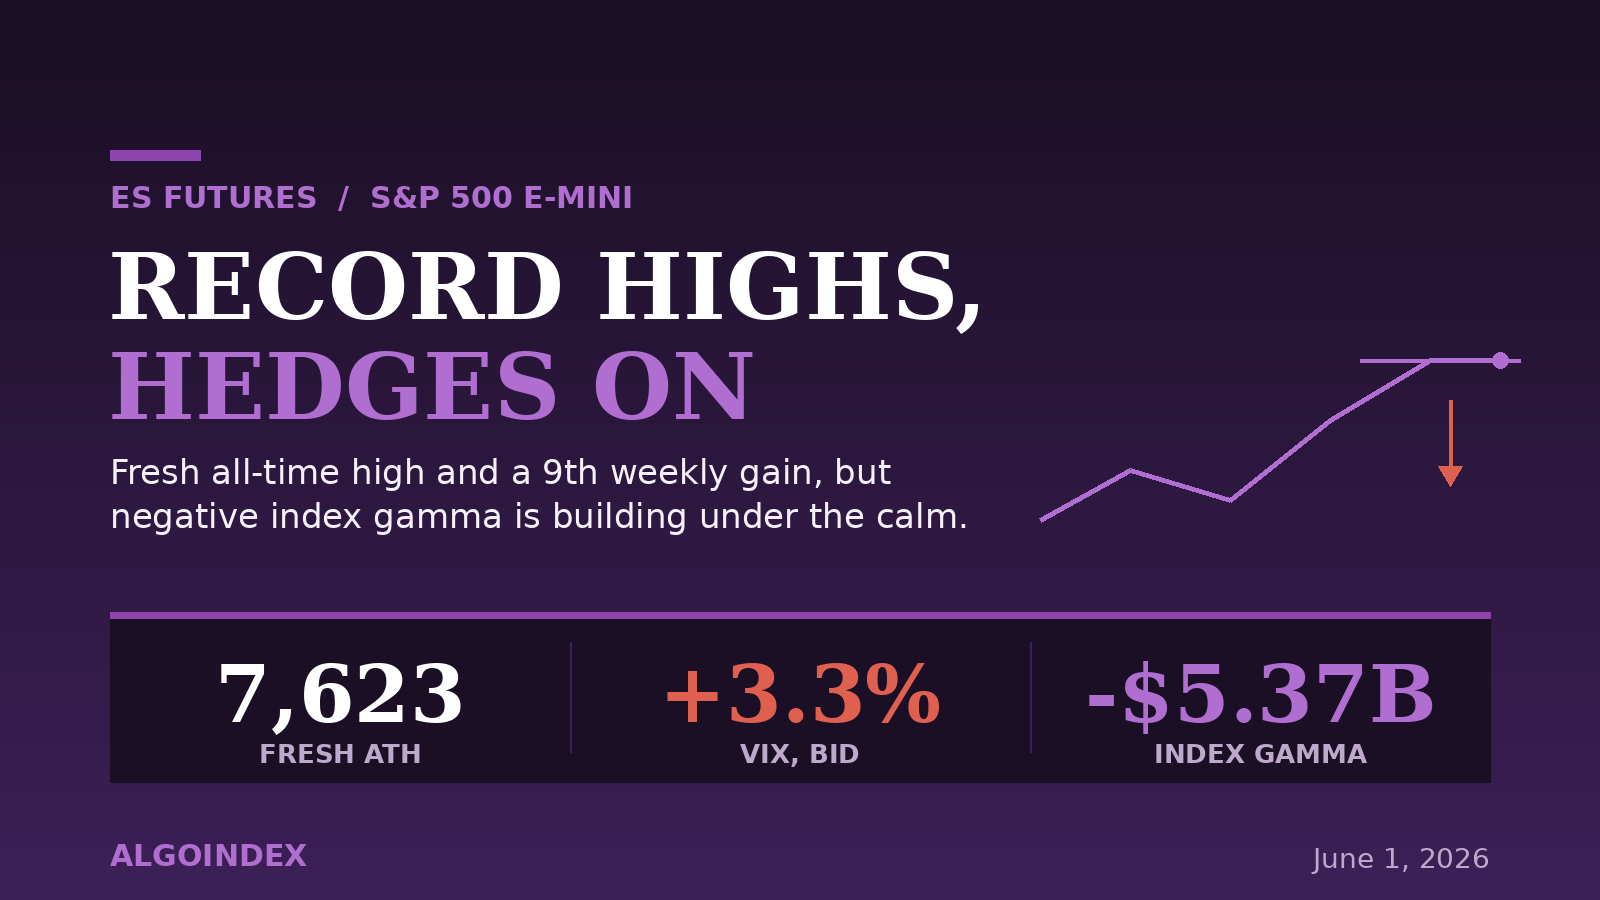
Over the weekend, two Iranian ballistic missiles arced toward a US base in Kuwait, and interceptors took them down before dawn. By the time the futures reopened, ES had printed a fresh record at 7,623 and was holding most of it. Crude jumped toward $92. The volatility index ticked up more than three percent. And equities, for the ninth week running, simply refused to go down.
That refusal is the whole question this morning. The S&P enters June at all-time highs, riding the longest weekly winning streak since 2023, with every timeframe pointing up and the computed composite reading a maximum-strength buy. On the surface, nothing is broken. Underneath the surface, three things changed over the weekend, and all three point the same direction: the geopolitical risk re-escalated, institutional options positioning turned defensively bearish, and the calendar filled with first-order events from this morning's manufacturing print straight through Friday's payrolls. Trend up, momentum waning, volatility cheap into real event risk, and hedges quietly building beneath a calm market. The path of least resistance is still higher, but the reward for chasing it just got smaller.
The cleanest way to hold both truths at once is to separate what the trend is doing from what the positioning is saying. They disagree right now, and the disagreement is the edge.
The Trend Has Earned Its Record
Start with the strength, because it is real and it is not subtle. The 14-day directional index reads 29.7 with positive directional movement at 39.5 against just 16.1 on the downside, the signature of a genuine, powerful uptrend rather than a drift. Price sits above every major moving average in a fully stacked alignment: 17.2% above the 200-day at 6,831, 14% above the 50-day, and comfortably clear of the 5- and 20-day. The Friday dip to 7,515 was bought and the index broke to new highs, leaving a clean higher-high sequence and a four-hour support shelf at 7,540. This is what a trend in control looks like.
The cost, as always, is distance. Riding 17% above the 200-day supports the move right up until it doesn't, and the further price stretches from its anchors the more violent the eventual snap-back tends to be. For now the structure is intact and the bulls own the level. The question is not whether the trend exists. It is whether the engine driving it is still firing.
Momentum Is Quietly Losing Thrust
It is not, quite. The 14-day relative-strength reading sits at 73.7, the 14-day stochastic is pinned near the top with %K at 94, and the daily oscillator is elevated near 82. Every horizon is overbought, which by itself only confirms the trend. The tell is the shape: the one-hour chart is printing a bearish divergence, with price making equal-to-higher highs while momentum makes lower highs. That is the same waning-thrust signature the market flashed on Friday, now repeating one level higher. A divergence is not a reversal, and the four-hour oscillator near 86 has only begun to curl rather than roll, but a market that needs ever-higher prices to keep its momentum readings flat is a market running up a down escalator.
Cheap Volatility Walking Into a Loud Week
Here is where the setup turns genuinely uncomfortable. At-the-money implied volatility on the two-day expiry sits at 9.29%, with an implied-volatility rank near 15% and a percentile around 28. Volatility is not just low, it is crushed, even cheaper than Friday. The 14-day average true range is about 68 points, framing a one-ATR session envelope of roughly 7,575 to 7,643 in the ES domain. The options market is pricing a sleepy day. The calendar says otherwise: this morning brings the ISM Manufacturing complex at 10:00 ET, and the prices-paid component matters as much as the headline because a hot reading feeds straight into the hawkish-rate narrative. Behind it sits one of the densest data weeks of the quarter.
A payrolls-week runway with a first-order event nearly every session. Red marks the highest-impact prints.
When volatility is this cheap going into a week this loud, the asymmetry favors owning optionality, not selling it, and it rewards defined-risk structures over naked direction. The market is charging almost nothing for protection against a week that has at least four ways to surprise it.
The Shift That Matters Most
The single most important change over the weekend happened in the options positioning, and it is worth stating plainly because the two desks that track it disagree at the margin. Index and ETF positioning has turned strongly defensive: total index delta sits near negative $3.15 billion and gamma near negative $3.46 billion, in the 95th percentile, driven by heavy put-buying. The S&P index layer specifically shows a large negative gamma reading near negative $5.37 billion, also 95th percentile. The technology fund options show historically extreme bearish delta paired with very high bullish vega, the fingerprint of desks positioning for a jump in technology volatility.
Negative gamma is not a directional call. It is an amplification mechanism. When dealers are short gamma, their hedging pushes them to sell into weakness and buy into strength, which accelerates moves rather than damping them. The counterweight is that the broad-market funds still carry positive gamma that cushions ordinary intraday chop and keeps price pinned near the highs. So the two reads reconcile: the cushion is real and it is why the market feels calm, but the index-option layer has shifted to a posture where a genuine catalyst could overwhelm the cushion and move faster than the quiet market implies.
That is the asymmetry in one picture. Upside is capped by a call concentration directly overhead. Downside, if it comes, has an accelerant underneath it that was not there a week ago.
Calm on the Surface, Hedges Underneath
The cross-asset picture tells the same story in a different language. Crude is bid near $92, up more than a percent and a half on the returning geopolitical premium. Gold is off about nine-tenths of a percent on profit-taking despite the headlines. The dollar is firm and flat. And the volatility index is up more than three percent even as equities hold their records. A risk-on surface with a volatility bid building underneath is the familiar late-cycle signature of a market that is calm with its hedges on.
Equities calm on top, a volatility and crude bid building underneath. The late-cycle calm-with-hedges signature.
The macro driver of the week is the dollar and the Fed. The dovish voice that spoke into Friday's open is done, and the rotation turns hawkish from here, with three policy speakers on the calendar against a wall of data. Desks note that hot data plus sticky manufacturing prices could push the market toward pricing an actual rate hike later this year, against the modest tightening priced now, a hawkish risk sitting under a complacent volatility surface. The engine holding the index up is the same one it has been for months: optimism on technology and artificial intelligence, with the semiconductor bellwether reporting Wednesday after the close as the week's marquee catalyst. Options desks already flag extreme call readings in the megacaps, the kind of froth that tends to mark late innings rather than early ones.
Where the Lines Are Drawn
For all the cross-currents, the level structure is clean and the decision zone is narrow. The heaviest call concentration sits at 7,612 in the ES domain, which is also the dealer-positioning resistance and the first pivot, and price is pressing just beneath it. Above that, 7,623 is the overnight record and the true breakout trigger, with 7,629 and 7,646 as the stretch targets on a momentum-expansion day. Beneath price, 7,590 is the session open and the intraday line that separates a constructive day from a rotational one. Below it sit the prior-day low near 7,577, dealer support at 7,562, and the max-pain magnet at 7,557. The line that matters most is 7,540, the four-hour breakout pivot: losing it shifts the near-term structure to neutral-down and unlocks the amplification scenario the positioning is braced for.
Practically, the whole day compresses into two numbers. 7,612 is the cap to clear. 7,540 is the line whose failure changes the character of the week.
The Four Paths and the Trade
Put it together and the session resolves into four scenarios. The base case is a pin-and-chop grind between 7,590 and 7,623, capped by the call concentration and cushioned by the broad-market gamma, a flat-to-slightly-positive day. A clean break and hold above 7,623 on strong internals is the upside case, carrying to 7,629 then 7,646, and it needs a constructive Iran headline or a cool-enough ISM to keep the rate worry off the table. A rejection at the ceiling that loses 7,590 is the equal-weighted downside case, unwinding toward 7,577 then the 7,562 to 7,557 support. And the low-probability tail, a hard escalation or hawkish shock that breaks 7,540, is the one where negative gamma amplifies the move toward 7,512 and below.
Range is still the base case, but downside outweighs upside this morning, and the tail carries an accelerant.
The trade reads two-sided, decided at the 7,612 to 7,623 ceiling. The long continuation wants an accept-and-hold above 7,623 after the opening range, entering on the retest, risking back under the call concentration, and targeting 7,635 then 7,646, but only if it is not running into a hot prices print. The fade wants a rejection at the ceiling and a loss of 7,590 on volume, entering on the breakdown retest near 7,588, risking back above the shelf, and targeting 7,577 then the 7,562 to 7,557 support, with a runner toward 7,540 only if a catalyst lights the negative-gamma fuse.
The discipline this morning is not to pick a side in advance. It is to trade small into a payrolls-week gauntlet, let the 10:00 print and the 7,612 ceiling cast the deciding vote, and respect that the cheapest volatility in weeks is sitting under the loudest calendar in weeks. We publish our performance methodology openly so every read can be measured against what it claimed, and as Friday's record-high read and Thursday's pre-PCE inflection both noted, the pin holds right until a headline gives the market permission to leave it. The difference this week is what waits underneath if it does.
A market at record highs with its hedges already on is not a contradiction. It is a warning written in a quieter font.
Related reading: Tuesday's read on the record rejection and the volatility coil.
See how AlgoIndex turns this kind of read into a disciplined daily signal.
View pricing →Foundational guides
New to S&P 500 futures? Start with What Are ES Futures, the ES, NQ, MES & MNQ point value and contract specs, gamma exposure (GEX) explained, and market internals: TICK, ADD, VOLD and VIX.