
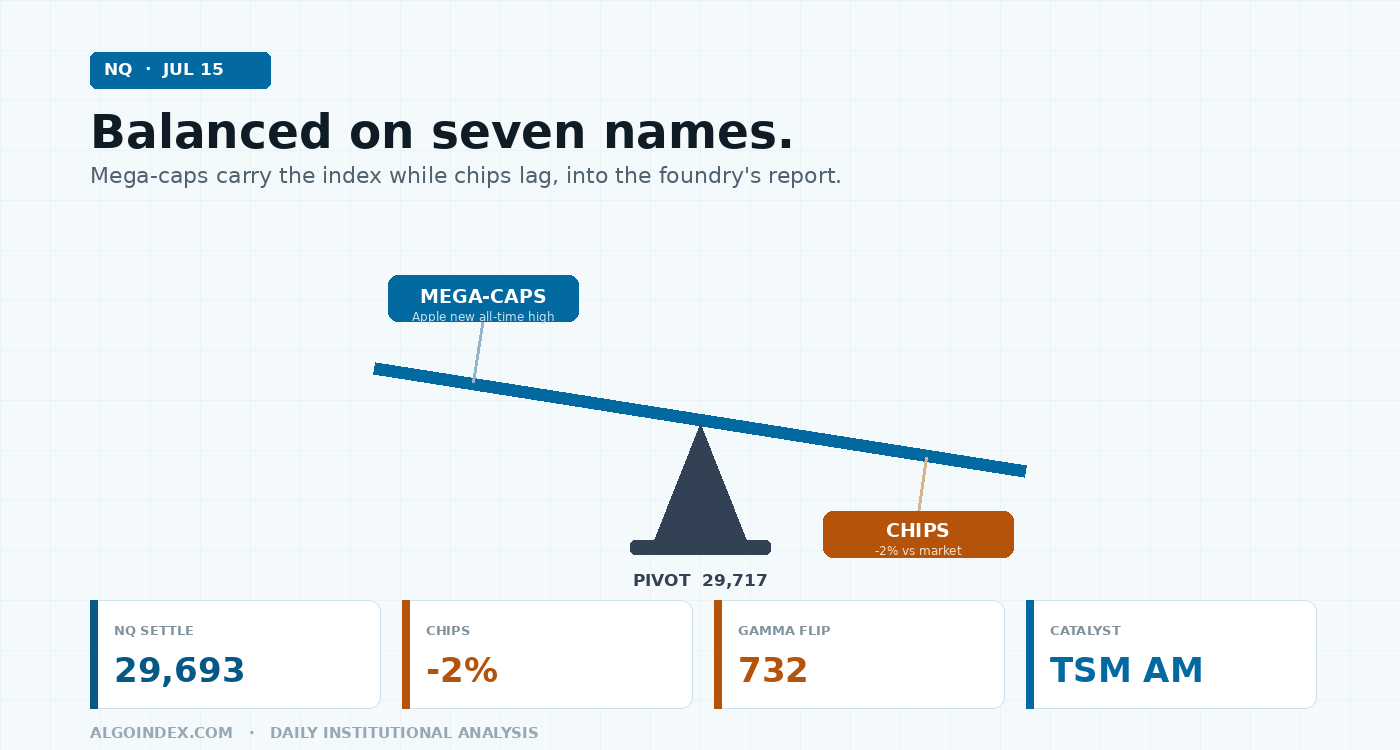
The Nasdaq-100 futures finished Wednesday broadly flat, the September contract settling near 29,693 and edging toward 29,720 to 29,748 on the reopen, up about 0.15 percent. The flat number hides a split: mega-caps carried the session, with Apple pressing to a fresh all-time high on heavy longer-dated call buying, while the semiconductor complex underperformed by roughly 2 percent. Price is consolidating below its fast averages yet sits well above the 100 and 200-day, so the larger uptrend is intact and the short-term market has gone sideways-to-soft. Thursday is a gate: Taiwan Semiconductor reports before the open, Friday brings monthly expiration, and the exchange-traded-fund proxy is in net-negative dealer gamma below 732, meaning hedging amplifies the move rather than damping it. The plan: favor longs on a hold or reclaim of the 29,717 pivot toward 29,910 and the 29,990 to 30,040 shelf. Neutral with a modest upward lean, low-to-moderate conviction.
A flat close is rarely the whole story, and it is not the story here. Beneath a session that moved the related large-cap index barely seventy basis points, the composition split cleanly in two. The largest mega-cap names did the work, Apple closing at a new all-time high near 328 and drawing sizable October and August upside call buying, while the semiconductor complex, the group the index most depends on, lagged the broad market by about 2 percent. A cap-weighted index can float on that kind of top-heavy strength for a while. Whether it keeps floating is Thursday's question, and Thursday hands the market the one catalyst that answers it.
Constructive while price holds the 29,690 to 29,720 pivot shelf, conviction low-to-moderate given the earnings gate. A materially soft chip guide or a Gulf escalation overrides the long.
Mega-caps on one side, chips on the other
Top-heavy strength holds a cap-weighted index up even when the average constituent is soft. The fulcrum is the 29,717 pivot; Taiwan Semiconductor decides which way the beam settles.
Wednesday's regular session was quiet and range-bound, the broad market absorbing a softer producer price report and extending gains from the cooler consumer inflation print earlier in the week. A sharp intraday rally between roughly 12:30 and 2:00 Eastern lifted the complex before it settled back near the flat line, and the futures tracked that pattern into the close before edging higher on the 6:00 reopen. The compressed profile speaks to positioning caution ahead of the earnings and expiration wave, not directional conviction.
The technical picture is a consolidation, and the moving-average stack is the clearest tell. Against a spot near 29,745, the 5-day average sits at 29,786, the 20-day at 29,896 and the 50-day at 29,827, all three overhead. Below price, the 100-day sits far lower at 27,706 and the 200-day at 26,835, with the year-to-date average around 27,253. Price is more than two thousand points above its 200-day line. The read is unambiguous: near-term momentum has cooled and price is working through the fast averages, but the intermediate and long-term trends remain strongly positive. This is a pullback within an uptrend, not a trend reversal.
On the daily chart the September contract is consolidating below its record high of 31,100, both the 52-week and 13-week peak, with the one-month high at 30,975 and the one-month low at 28,910 framing a broad envelope. Price near 29,720 sits in the middle-lower third of that range, closer to the prior consolidation shelf than the highs, though the five-day change of plus 224 points, about 0.76 percent, keeps the very-near-term drift mildly constructive. The four-hour timeframe shows a series of lower highs since the late-June push toward the record, with pullback lows holding progressively above the prior month's base, a market compressing beneath resistance rather than breaking down. The line in the sand for the intermediate-uptrend thesis is the 29,050 to 29,370 band; a decisive break there shifts the character from consolidation to correction.
Momentum offers no edge. The 14-day relative strength index reads about 49, squarely mid-range. The 9-day raw stochastic sits near 56 percent with the smoothed lines in the high-40s to low-50s, while the 14-day stochastic percent-K is around 43 and the 20-day near 36 and declining, a modest loss of short-term momentum. The multi-indicator composite registers a mild 20 percent sell with an overall reading of hold. No overbought excess to fade, no oversold spring to buy: direction is contingent on the catalyst.
"Below the 732 inflection, dealer hedging is positioned to amplify moves, so a break of a level tends to extend rather than mean-revert until price reclaims that upper marker."
Constructive bets over a destabilizing gamma backdrop
Positioning is the interesting part, because it points two ways at once. The directional bets are constructive: the concentration of longer-dated call buying in the mega-cap names, and a record 30-day hedging-impulse reading in that group, suggest institutions are leaning into upside ahead of next week's earnings wave rather than hedging for a decline. Options flow across the group generated its largest single-day positive hedging-impulse reading in 30 days, driven by longer-dated call accumulation.
The gamma backdrop underneath those bets is destabilizing. Using the Nasdaq-100 exchange-traded fund as the options proxy, the upper volatility inflection, where positive gamma would begin to stabilize the market, sits near 732; the lower volatility point is far below at 505 and not near-term relevant. The fund closed at 719.68 and traded near 718 in the evening, a fractional 0.23 percent decline, leaving price in the net-negative-gamma zone beneath 732. Put gamma dominates at roughly negative 1.14 billion against call gamma near 63.7 million, the put-to-call open-interest ratio is about 1.37, the implied-volatility rank sits near 57 percent, and the one-day options-implied move is about 10.5 dollars. The combination, constructive directional bets layered over a destabilizing gamma profile, is consistent with a market that can trend hard once a catalyst chooses a direction.
The market-wide desk read, from the evening note published at 5:17 Eastern, fills in the mechanics. A sharp midday rally in the benchmark coincided with a swing in the real-time hedging-flow measure from roughly negative 4 billion to positive 4 billion, implying on the order of 8 billion of dealer buying into the move. Longer-dated call buying dominated both index-options and single-stock flow, and the mega-cap group posted its highest daily hedging-impulse reading in a month. The desk's summary flags that the ingredients for a sharp correction are present but a trigger is still needed, citing Iran, macro data or an earnings miss as candidates, while pointing to the technology-earnings wave as the potential upside catalyst and Friday's expiration as a mechanism that could free up positioning.
Disinflation tailwind, hawkish counterweight
The rates backdrop turned incrementally friendly and is the primary tailwind under equities. Consumer prices rose 3.5 percent year over year, below the 3.8 percent consensus and down from a prior 4.2 percent, and producer prices came in at 5.5 percent year over year against a 6.2 percent forecast. Both point to cooling inflation, which supported a rally in Treasuries and trimmed tightening premium from the forward curve. The counterweight is a distinctly cautious central bank: the Fed chair, in multi-hour congressional testimony, emphasized there is no tolerance for persistently elevated inflation and deliberately downplayed the softer consumer print, while another policymaker flagged that stricter policy, even additional hikes, could be required if core readings run hot. The net for the Nasdaq is a supportive disinflation impulse capped by a hawkish posture that limits how far rate-cut hopes can run.
Which returns everything to the chip complex, the swing factor for the index. Chips underperformed by roughly 2 percent Wednesday even as ASML's results were read as supportive for artificial-intelligence demand. The pivotal event is Taiwan Semiconductor's report before Thursday's open: as the foundry at the center of the AI supply chain, its guidance on capital spending and AI demand sets the tone for the entire chip cohort and, by extension, a large slice of the Nasdaq. A strong print and constructive outlook would likely resolve the semis-versus-mega-cap divergence to the upside; a disappointment would pressure the most heavily weighted growth names. Geopolitics reintroduced a risk tail, with escalating tension around Iran and the Strait of Hormuz, an expanded military posture, a reinstated blockade and a naval interdiction in the Gulf; for equities the transmission channel is energy prices and risk sentiment rather than a direct earnings hit, but a sharp escalation is exactly the exogenous trigger that could convert low-volatility complacency into a fast repricing. Cross-asset signals are calm but compressed: the broad-market volatility gauge closed near 15.7, the volatility-of-volatility measure near 92 pointed to muted demand for downside hedges, and with near-term implied volatility compressed into single digits ahead of a dense event calendar, there is a reasonable case that options are underpricing the risk around expiration and the earnings that follow.
The trade: long the pivot hold, respect the round number
Price holds above a well-defined pivot shelf, the intermediate and secular uptrends are intact, and institutional flow is leaning into upside through longer-dated mega-cap call buying. The immediate support is the 29,690 to 29,720 zone, where the daily pivot at 29,717, the 9-day average at 29,716 and the prior settlement at 29,693 converge. A loss of that pocket opens the computed target near 29,623, then the 29,476 one-standard-deviation support and the first-level pivot support at 29,373. The trade is contingent on a constructive, or at least non-damaging, Taiwan Semiconductor reaction.
Target 1 at 29,910 is the one-standard-deviation marker. Target 2 at 29,990 to 30,040 is the pivotal confluence where the 40-day average, the two-standard-deviation band, the round 30,000 handle and the first-level pivot resistance all converge, the single most important level bulls must reclaim to argue for a fresh leg. Target 3 at 30,100 is the extension on a Taiwan Semiconductor beat. The alternate is a Path B fade: short a first-test rejection of the 29,990 to 30,040 shelf back to the 29,717 pivot and then 29,623, stop above 30,080, fitting a scenario where the earnings reaction is mixed and price stalls under the round number. Stand aside if the chip report produces a violent open gap that leaves price whipsawing outside the expected range, and do not fade the initial post-earnings extension given the negative-gamma environment.
Expected range: low about 29,450, mid about 29,720, high about 30,000, with the event calendar arguing for the wider realized outcome.
Mega-caps are holding the beam level. Taiwan Semiconductor decides whether the chips catch up or the whole thing tips.
The complete data picture
Every level and reading from the Wednesday evening NQ review. Levels are September E-mini futures prices unless a fund-proxy or cash construct is named. Nothing rounded away.
| Resistance (bottom to top) | Support (top to bottom) |
|---|---|
| 29,790 to 29,820: the 5-day and 18-day averages | 29,690 to 29,720: daily pivot 29,717, 9-day average 29,716, prior settlement 29,693 |
| 29,910: one-standard-deviation marker, the first meaningful line | 29,623: computed target on a pivot loss |
| 29,990 to 30,040: 40-day average, two-SD band, the 30,000 handle and first-level pivot resistance; the shelf bulls must reclaim | 29,476: one-standard-deviation support |
| 30,383 second-level pivot resistance; 30,704 third-level | 29,373 first-level pivot support; the 29,050 to 29,370 band is the intermediate line in the sand |
| 30,975 one-month high; 31,100 record, 52-week and 13-week high | 29,052 second-level pivot support; 28,910 one-month low; 28,707 third-level pivot support |
A cap-weighted index balanced on seven names, waiting on the foundry at the center of the chain.
See how AlgoIndex turns dealer positioning and hedging flow into systematic signals. Read today's crude note and the pillar on how dealer call and put walls behave.
View pricing


