
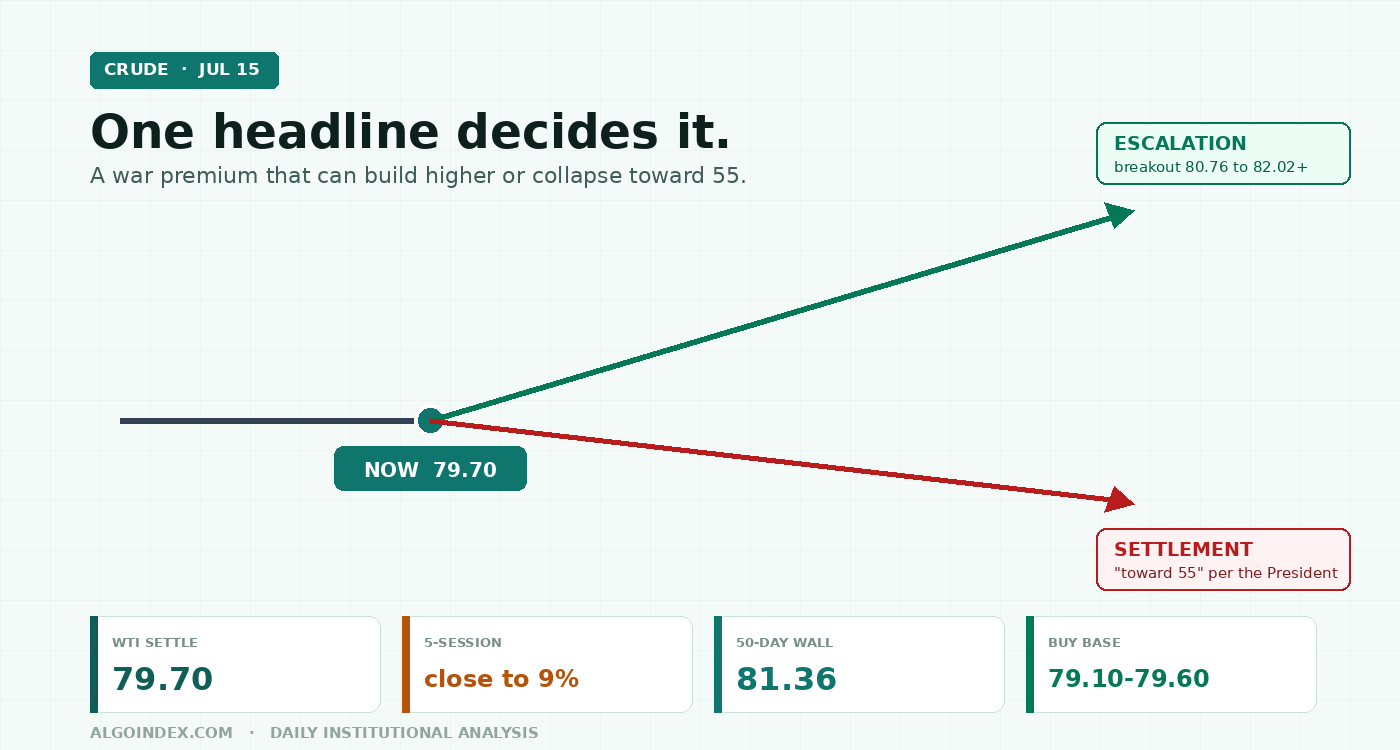
WTI crude settled Wednesday near 79.70, up about 1.30 percent, extending a five-session run of nearly 9 percent driven by the Persian Gulf confrontation and the running threat to the Strait of Hormuz. A supportive inventory draw of 1.69 million barrels reversed the prior week's build and validated the tighter-supplies story. But the advance is now stretched: short-cycle stochastics are pinned above 90, the composite reads a weak 24 percent buy with the headline trend signal on a sell, and the 50-day average at 81.36 sits directly overhead. The defining feature is that this premium is reversible in a single headline: the President said oil could fall toward 55 dollars once Iran settles down. The plan: a long continuation from the 78.87 to 79.60 base toward 80.35, 80.76 and the 81.21 to 81.36 wall, where the risk-reward turns. Cautiously bullish continuation, reduced conviction.
Crude is riding a real, physical supply story and a stretched, headline-driven premium at the same time, and Thursday sits on the knife-edge between them. Wednesday's session opened at 78.96, dipped to 77.77 in the morning, then reclaimed the pivot and pressed to 80.13, tagging the round 80 handle before easing to settle near 79.70. The full-session range spanned roughly 2.36 dollars, in line with the recent 2.89 average daily range, an orderly trend day rather than a volatility spike, on healthy volume of roughly 201,000 contracts against open interest near 258,000. The move extends a five-session advance of positive 6.59, close to 9 percent, one of the sharpest short bursts of the year.
A strong uptrend and a real supply story, stretched, capped by a falling intermediate average, and acutely exposed to a single de-escalation headline.
The whole trade hangs on one headline
A supply premium that can build further on escalation or collapse on a settlement headline. That two-way risk is the defining feature of the session.
The bullish case is straightforward and physical. Today's weekly government petroleum status report showed a crude draw of roughly 1.69 million barrels, slightly below the expected 1.82 million but a firm reversal of the prior week's build of nearly 3 million, fitting a broader narrative of tightening balances. Overlaid on that is the acute risk to physical flows through the Strait of Hormuz, through which a very large share of seaborne crude transits, which keeps a structural disruption premium embedded in the front of the curve. A supply-scare of this kind typically steepens front-month backwardation as prompt barrels command a premium over deferred, and the sharp front-led rally is consistent with that dynamic. The strength is broad rather than isolated: the whole barrel and the product complex are being repriced in unison by the same Hormuz risk.
The bearish case is a single sentence away. The newsflow was heavy, with reports the President is leaning toward expanding military operations against Iran, fresh strikes referenced near Bandar Abbas said to have caused no casualties or damage, and forces disabling a non-compliant vessel in the Arabian Gulf. The President stated the Strait of Hormuz is open to all ship traffic except for Iran and pledged to continue until Tehran stops targeting shipping. But the same official handed the market its reversal scenario, suggesting oil could fall toward 55 dollars once Iran settles down. A market that has surged 13 percent in a week on a headline-driven premium carries elevated reversal risk if the catalyst fades, and the stretched positioning makes that unwind faster when it comes.
"The two-way nature of this risk, a supply premium that can build further on escalation or collapse on a settlement headline, is the defining feature of the current environment."
Above the whole stack, except the one that matters
The daily trend has turned firmly higher over two weeks. Price at 79.70 sits above the 5-day at 75.94, the 20-day at 72.48, the 100-day at 79.58, the 200-day at 69.48 and the year-to-date mean at 74.83, a broadly bullish alignment across short and long horizons. The single exception is the important one: the 50-day average at 81.36 sits above current price and defines the first overhead resistance the rally must clear to confirm a genuine trend extension. The 40-day cross near 79.60 is the immediate dynamic support beneath price. Within the broader context the contract remains roughly 16 percent below the 52-week high of 95.30 and roughly 44 percent above the 52-week low of 55.49, in the upper-middle of its annual distribution; the one-month high at 80.54 is the immediate daily objective, the one-month and 13-week low at 67.12 the structural downside reference far below.
The momentum readings are strong but stretched, and that split is the day's central caution. The 9-day relative strength reads 68.15 and the 14-day 58.53, the former approaching overbought while the latter stays in a healthy neutral-to-firm band. Short-cycle stochastics are extended, with the 9-day and 14-day percent-K both at 92.50, deep in overbought territory, a common late-trend caution. The directional trend indicators are unambiguously bullish on the short horizon: the 9-day average directional index at 33.69 with positive direction at 35.35 against negative at 12.14 signals a strong, well-established uptrend, and the 14-day at 21.05 with positive direction still dominating confirms the bias at more moderate strength. The dissenting voice is the multi-indicator composite, a weak 24 percent buy overall with the headline trend signal on a sell, driven by the medium-term grouping at 25 percent sell where the 50-day average and the intermediate crossovers weigh against price, even as the short-term grouping reads a firm 60 percent buy and the long-term grouping a 67 percent buy.
Volatility is elevated in line with the geopolitical backdrop. The 14-day average true range is 3.48 dollars, about 4.35 percent of price, the 9-day 3.40 and the 20-day 3.57, with historic volatility near 46 to 47 percent and the 14-day average daily range at 2.89. Applying the 3.48 true range around the pivot at 78.87 frames a one-session band of roughly 75.4 to 82.4; measured around the 79.70 settle, roughly 76.2 to 83.2. Size for a wide, headline-sensitive session. One sourcing note: the intermediate swing-structure read is inferred from computed indicators this run rather than a direct chart scan, though the indicator set, the reclaim of the pivot and 40-day average with a positive directional index, is consistent with an established up-swing that has not yet printed a lower high.
A weaker dollar under a hawkish Fed
The rates and inflation backdrop is unusual and worth stating plainly. Consumer prices printed softer this week, the annual rate easing to 3.5 percent below the 3.8 percent expected, and producer prices came in softer at 5.5 percent versus a 6.2 percent forecast with the core producer rate at 4.7 percent. Despite the cooler data, the central-bank leadership struck a firm, inflation-fighting tone, emphasizing no tolerance for persistently elevated inflation and a bias the market read as tilted toward hiking rather than cutting while core inflation sits near 2.6 percent, well above target. The softer prints still removed one pillar of dollar support by trimming near-term hike expectations, and the dollar weakened on the week, a modest tailwind for dollar-denominated crude, with the euro holding support near the 1.1400 area. Risk appetite was constructive, equities advancing a second session as softer producer inflation eased tightening fears, though semiconductor names lagged with a key chip index down about 2.1 percent. A weaker dollar, firm risk sentiment and a physical supply scare is a coherent bullish backdrop for the front of the curve, and the commentary flow tied the roughly 13 percent weekly surge directly to the Middle East escalation.
The demand side takes a back seat this week and gets its next clean read Thursday. Softer inflation and a still-expanding equity market point to a resilient consumer, but the growth picture is clouded by a central bank signaling a bias toward tighter policy. Thursday's retail sales report is the next demand read, and its effect runs through the dollar: a soft number that weakens the dollar further adds a tailwind, a strong number that firms the dollar and revives hike expectations is a modest headwind. There is no weekly petroleum inventory print Thursday, that report already cleared today, so the session driver is macro plus geopolitics rather than a fresh supply number.
The trade: long the base, sell into the wall
A strong established uptrend, a supportive inventory draw and an active supply premium argue for a long continuation, with price holding above the pivot and the 40-day average into the close. The first support base is the pivot at 78.87 layered with the 40-day cross at 79.60 just above it, the zone price reclaimed and defended today. Below sit the prior close at 78.68, the 38.2 percent retracement near 77.88, and the key near-term base at 77.20 to 77.77, today's low plus the first support point; a decisive break there opens the second support at 75.72, the one-standard-deviation support near 74.67 and the downside objective toward 74.05.
Target 1 at 80.35 is the first resistance point in the round-80 grouping. Target 2 at 80.76 is the computed target alongside the one-month high at 80.54 and the 80.09 retracement, making the 80.09 to 80.76 zone the first battleground. Target 3 at 81.21 to 81.36 stacks the 13-week midpoint retracement and the 50-day average, the most important intermediate ceiling, followed by the second resistance at 82.02. That band is where the risk-reward turns unattractive. The macro override is the one that governs everything: a credible Iran de-escalation or settlement headline overrides the technical setup and argues for standing aside or flipping short, given the explicit reference to a move toward 55 dollars. The alternate is a lower-conviction, sized-down fade of a failed high: if price rallies into the 81.21 to 82.02 grouping and stalls with overbought stochastics rolling over, short 81.20 to 82.00 on a rejection, stop above 82.20, targets 80.35 then 79.60. Stand aside if price chops directionless between 78.87 and 80.13 with no opening-range resolution, if a major geopolitical headline is imminent or breaking with direction unclear, or in the first fifteen minutes after the 08:30 data block before the dollar reaction settles.
Expected range: low 77.20 to 77.77 (downside tail 75.72), mid 78.50 to 80.75, high 80.76 into 81.21 to 82.02 with a statistical ceiling near 82.4 to 83.2.
A real supply story, a stretched rally, and a wall at 81.36. The market is long the war premium, and the President already named the exit at 55.
The complete data picture
Every level and reading from the Wednesday evening CL review. Prices are NYMEX WTI front-month (September reference) futures. Nothing rounded away.
| Resistance (bottom to top) | Support (top to bottom) |
|---|---|
| 80 handle, today's high 80.13, first resistance 80.35 | 79.60 the 40-day average cross; 78.87 daily pivot (reclaimed and defended) |
| 80.09 to 80.76 first battleground: 61.8 percent retracement 80.09, one-month high 80.54, computed target 80.76 | 78.68 prior close; 77.88 the 38.2 percent retracement of the 13-week range |
| 81.21 the 50 percent 13-week retracement; 81.36 the 50-day average, key intermediate ceiling | 77.20 to 77.77 near-term base: today's low 77.77 and first support point 77.20 |
| 82.02 second resistance; 82.69 one-standard-deviation band; 83.50 third resistance | 75.72 second support; 74.67 one-standard-deviation support; 74.05 downside objective |
| 84.35 two-standard-deviation band; 84.54 the 38.2 percent retracement from the 13-week high; 95.30 52-week high | 67.12 one-month and 13-week low; 55.49 52-week low |
Long the base, sell into the 81.36 wall, and keep one hand on the exit. The reversal is a single headline away.
See how AlgoIndex turns structure and positioning into systematic signals. Read today's Nasdaq note and today's gold note.
View pricing


