
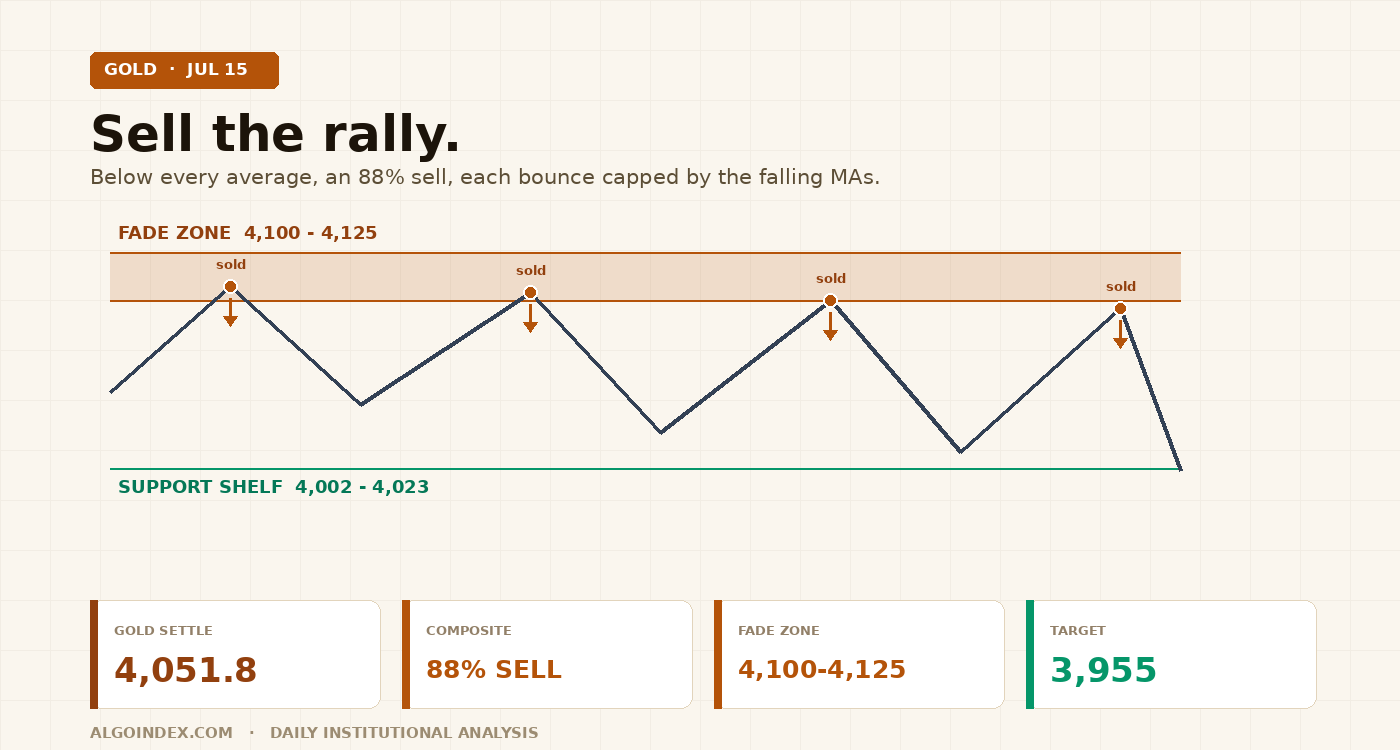
Gold settled Wednesday at 4,051.8, down 0.44 percent, after a failed push to 4,089 and a grind down to 4,023 that recovered into a mid-range close just under the pivot. The metal sits below every major moving average, and the trend-strength reading near 38 with the negative directional line beating the positive roughly two to one describes a downtrend that is strong and intact. A cooler producer-price print gave a modest tailwind, but a firm dollar near its 100.50 support and risk-on equities capped any safe-haven bid. The short-term picture is oversold enough to bounce; the medium-term structure is decisively heavy, an 88 percent sell composite. The plan: fade strength into the 4,100 to 4,125 resistance band toward 4,002 and 3,955, while respecting that dovish Fed testimony could spark a corrective squeeze. Bearish with a bounce caveat, moderate conviction.
Wednesday was the pattern in miniature. Gold opened soft at 4,059.8, built the day's high early at 4,089.1, and that push failed right where it was supposed to, beneath the falling short moving averages. The rest of the session was a grind lower to 4,023.3 before a late recovery to 4,051.8 left the settle pinned just under the daily pivot at 4,057.5. Volume of 111,150 contracts was a normal mid-week pace. Buyers defended the low-4,020s but had no strength to reclaim the 4,090 area. That is a rally that gets sold, which is the whole thesis for Thursday.
Rallies into resistance are the higher-probability fade, but the downside needs a clean break of the 4,002 to 4,023 shelf to extend. A dovish policy tone could squeeze the stretched shorts.
Every rally is a lower high
Lower highs, each capped beneath the descending short averages. The trade is to sell strength into the band, not to chase the lows.
The daily chart puts the correction in perspective. The one-month high sits far overhead at 4,403.6 and the 13-week high at 4,953.8, underscoring how far the metal has fallen. The nearer references are the one-month and 13-week low at 3,955.4, the first meaningful downside objective, inside a 52-week range of 5,706.0 to 3,441.5. Range position within the trailing month is the lower third, the profile of a market that has been distributing rather than accumulating. The 4-hour swing structure is a sequence of lower highs and lower lows since the roll off the highs, each bounce capped beneath the descending short averages, and today's failed push to 4,089.1 fits that pattern exactly.
Spot at 4,051.8 is below the entire moving-average stack, and the trailing price change by window quantifies the damage: down 6.54 percent over 20 days, down 13.10 percent over 50 days, down 19.81 percent over 100 days. The 5-day average sits at 4,079.4, the 20-day at 4,128.8, the 50-day at 4,367.3, the 100-day at 4,636.8, the 200-day at 4,559.0 and the year-to-date mean at 4,707.1. Only the 200-day window is still net positive, at plus 4.79 percent, which confirms this is a sharp correction inside a longer up-move rather than a completed reversal. The first overhead average to reclaim is the 5-day at 4,079.4, then the 9-day cross near 4,107.9 and the 18-day near 4,104.3.
The oscillator and trend readings frame the day's central tension. Relative strength sits in the low 40s across windows, 42.6 on the 9-day, 41.1 on the 14-day, 40.5 on the 20-day, weak but not yet at outright oversold extremes. The stochastic complex is low, the 9-day raw at 34.0 with the fast line at 31.1 and slow line at 40.5, the 14-day raw at 42.9. But the trend-strength picture is the standout and it is not ambiguous: the directional index reads 38.7 on the 9-day and 38.3 on the 14-day, with the negative directional line at 24.3 against a positive line of only 9.2. That is a strong, still-intact downtrend, and the multi-indicator composite reads 88 percent sell. Oversold enough to bounce, heavy enough that the bounce is a fade.
"That combination, oversold oscillators inside a strong downtrend, raises the odds of a counter-trend bounce, which is why the plan favors selling strength rather than chasing weakness at the lows."
A firm dollar is doing the work
Today's producer-price data came in cooler than expected, core wholesale inflation at 4.7 percent year over year against a 5.1 percent consensus and the monthly core reading at 0.2 percent versus 0.3 percent expected, a mild disinflationary signal. In an ordinary week that helps gold. It did not, and the reason is the dollar. The dollar index is holding a support base near 100.50, a level flagged as defensible while energy prices stay bid, and a firm dollar is a direct headwind for the metal. Commentary attributed to a senior Fed voice acknowledged progress on the recent consumer-price print while downplaying it and stressing there is plenty of work ahead, a tone that keeps a near-term easing off the table and blunts gold's response to softer data. Rate expectations remain the swing factor: the market wants to price easing, officials keep leaning against it, and real yields stay sticky, which keeps gold's opportunity cost elevated.
Two structural forces sit on either side of that. Safe-haven flows were muted, with a de-escalation on European transit charges and broadly risk-on equity sentiment, helped by strong semiconductor earnings and renewed artificial-intelligence optimism, reducing the defensive premium; absent a fresh geopolitical shock, gold trades on rates and dollar mechanics rather than fear, which keeps rallies corrective in character. On the other side, official-sector demand remains the structural bid beneath the market and the reason the 200-day trend is still net positive. That demand tends to be price-insensitive and accumulative on weakness, which argues for treating the 3,955 area and the broader 3,880 to 3,955 zone as a region where dip-buying interest historically firms rather than a place to press shorts aggressively.
The proxy holds its lower strikes, for now
Using the gold exchange-traded fund as the dealer-positioning proxy, a stand-in for the metal rather than the futures themselves, it settled near 372.74 against a prior close of 372.15. Dealer-positioning levels zone between roughly 360 and 375 in proxy terms. The upper concentration near 375 acts as call-side resistance and a potential upside magnet on strength, while the 368 to 370 area below spot behaves as put-side support. The proxy is trading just beneath that upper strike, a configuration that dampens upside follow-through and encourages mean-reversion so long as price holds above the lower support strikes.
The most important downside reference is a volatility inflection level near 360. Above it, dealer positioning is relatively stabilizing and rallies get sold into the upper strike; a decisive break below it would flip positioning toward destabilizing and open the door to a faster, trend-extending move lower. Translated to the futures, gold's near-term behavior stays two-sided and range-respecting while the proxy holds its lower strikes, and a genuine downside acceleration in the metal would likely coincide with the proxy losing its 360 area.
The trade: sell the band, target the shelf
Price sits below every major moving average, the trend-strength readings describe a strong and intact downtrend, and the composite is 88 percent sell. The higher-probability trade is to sell a rally into the overhead supply zone rather than chase the lows. Immediate resistance is the daily pivot at 4,057.5, with the settle just beneath it. The 9-to-18 day moving-average cross near 4,082 to 4,090 aligns with today's session high at 4,089.1 to form the first real supply shelf, the 5-day at 4,079.4 sitting inside it. The heavier band is 4,104 to 4,125, where the 18-day cross at 4,104.3, the 9-day cross at 4,107.9, the first-level resistance at 4,124.7 and the one-standard-deviation band at 4,121.2 stack together. That is the fade zone.
First support is the first-level pivot support at 4,002.6, reinforced by the one-standard-deviation support at 4,018.2 and today's low at 4,023.3, which together define the 4,002 to 4,023 demand shelf. A daily close below it opens the two and three-standard-deviation supports at 3,996.8 and 3,980.4, then the 13-week and one-month low at 3,955.4, the primary downside objective, with the second-level pivot support at 3,935.4 and third-level at 3,880.5 beneath. The macro override is the dollar: a clearly dovish tone in the day-two Fed testimony, or a soft US housing print that weakens the dollar through its 100.50 support, would favor a corrective squeeze, so reduce size or stand aside if the dollar breaks 100.50 decisively. The alternate is the mean-reversion long: if gold holds the 4,002 to 4,023 shelf and reclaims the pivot at 4,057.5 with momentum, a long toward 4,089 and 4,104 is reasonable with a stop below 3,995, a counter-trend, faster-management trade suited to the oversold readings, not a trend position. Stand aside if price chops directly around the pivot with no clean rejection of either shelf, or in the 15 to 30 minutes around the Fed testimony and major data until direction is established.
Expected range: low band 3,995 to 4,002, mid pivot area 4,050 to 4,058, high band 4,105 to 4,125, anchored on one average-range unit of roughly 110 points around the 4,052 settle.
Oversold enough to bounce, heavy enough that the bounce is a fade. A firm dollar keeps the pressure on until Thursday's testimony says otherwise.
The complete data picture
Every level and reading from the Wednesday evening GC review. Prices are COMEX gold front-month (August) futures unless a proxy construct is named. Nothing rounded away.
| Resistance (bottom to top) | Support (top to bottom) |
|---|---|
| 4,057.5 daily pivot (settle just beneath) | 4,023.3 today's session low |
| 4,079.4 5-day average; 4,082 to 4,090 the 9-18 day cross and today's high 4,089.1, first supply shelf | 4,018.2 one-standard-deviation support; 4,002.6 first-level pivot support (the 4,002 to 4,023 demand shelf) |
| 4,104 to 4,125 fade zone: 18-day cross 4,104.3, 9-day cross 4,107.9, first-level resistance 4,124.7, one-SD band 4,121.2 | 3,996.8 two-SD support; 3,980.4 three-SD support |
| 4,128.8 20-day average; 4,142.6 two-SD band; 4,159.0 three-SD band; 4,179.6 second-level resistance | 3,955.4 one-month and 13-week low, primary downside objective |
| 4,246.8 third-level pivot; 4,403.6 one-month high; 4,953.8 13-week high; 5,706.0 52-week high | 3,935.4 second-level pivot support; 3,880.5 third-level; 3,441.5 52-week low |
Below every average, an 88 percent sell, and a firm dollar keeping the lid on. Sell the rally, not the low.
See how AlgoIndex turns trend and positioning into systematic signals. Read today's Nasdaq note and today's crude note.
View pricing


