
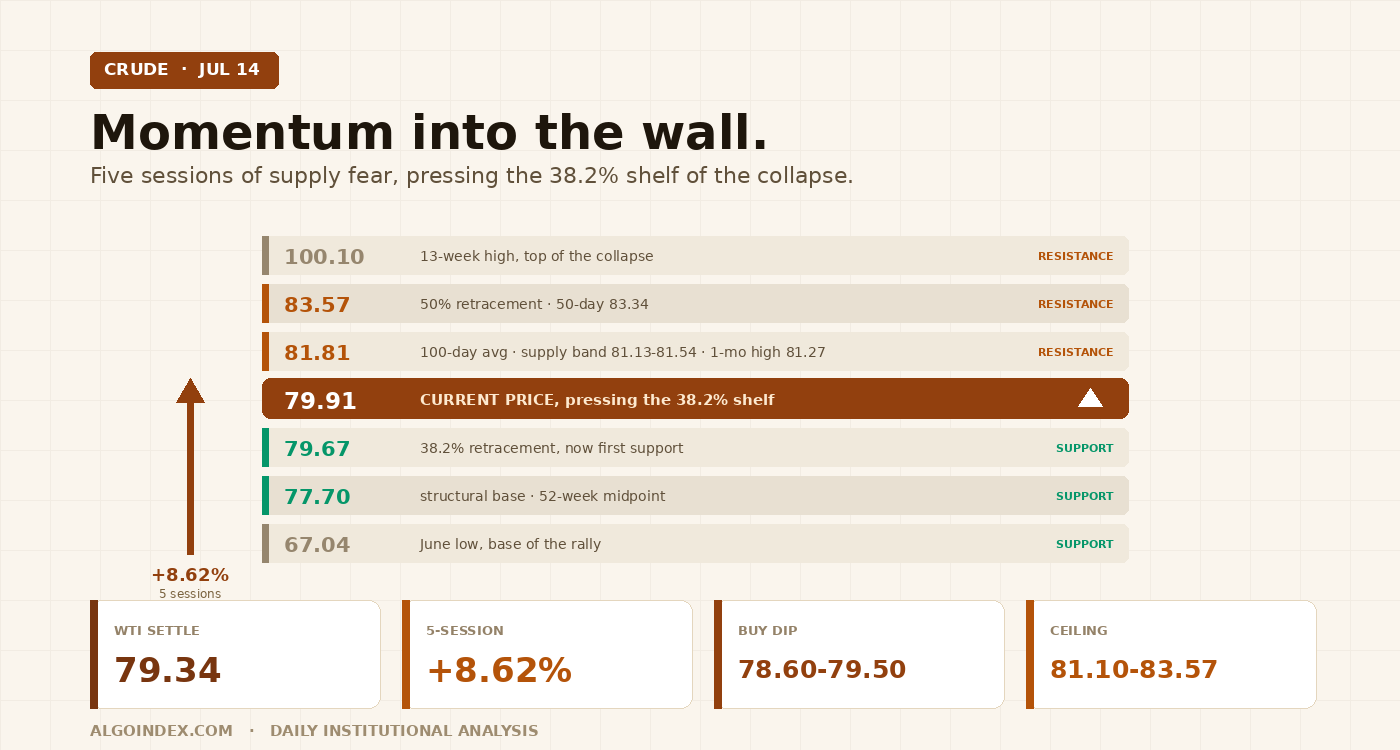
WTI crude settled Tuesday at 79.34, up 1.54 percent to a fresh one-month high, extending a five-session run that now totals 8.62 percent. The move is pure supply fear: the US-Iran truce has collapsed, fresh attacks on shipping are thinning Strait of Hormuz traffic, a blockade on Iranian vessels was reimposed, and US forces struck again. Gasoline confirmed it, closing up nearly 2 percent at a six-week high. But the rally is running hot into a wall: stochastics are pinned above 90 across every window, price is pressing the 38.2 percent retracement of the entire collapse from 100.10 to 67.04, and the 50-day and 100-day averages sit overhead at 83.34 and 81.81. This is powerful momentum inside a damaged larger structure. The plan: buy dips into 78.60 to 79.50, stop under 77.60, target 81.10 then the low-83s. Bullish, moderate conviction, buy the dip rather than chase.
Five sessions, plus 8.62 percent, and every point of it is about barrels that cannot move. The truce between the United States and Iran collapsed, the conflict went onto the water, and fresh attacks on shipping in the Strait of Hormuz are actively reducing tanker traffic through a waterway that carries roughly a fifth of global oil flows. A blockade on Iranian vessels transiting the strait was reimposed Tuesday, two tankers were reported attacked in Omani waters on the southern route, and US forces launched another round of strikes. Every incremental escalation subtracts real barrels in transit time, insurance cost and rerouting, whether or not production itself is hit. Crude settled at 79.34, up 1.20 on the day, and the evening reopen pushed straight to an 80.24 spike before settling near 79.91.
A momentum rally inside a damaged larger structure, fueled by headlines that reverse as fast as they arrive. Buy the first structural dip, do not chase an overbought print into overhead resistance.
One week into repairing a three-month collapse
The daily chart tells the tension in a single number. The 13-week picture runs from 100.10 at the April-era high down to 67.04 at the June low, and the current 79.90s put price almost exactly on the 38.2 percent retracement of that entire fall, computed at 79.67. Price has now closed above that retracement, which converts it from resistance into first support on any pullback. That is a real technical accomplishment, and it is also a warning: a countertrend rally that reclaims its first Fibonacci shelf has done the easy part. The hard part is overhead.
Above the 38.2 percent shelf sits the only daily swing before the 50 percent retracement: the one-month high at 81.27, guarded by a falling 100-day average.
The moving-average stack tells the countertrend story precisely. Price at 79.91 sits far above the 5-day at 76.18, a stretched 4.9 percent gap that by itself argues for consolidation, well above the 20-day at 72.83 and the 200-day at 70.64, but below the 100-day at 81.81 and the 50-day at 83.34. The 100-day lands directly on the 81.13 to 81.54 resistance zone, making that area a triple test: horizontal pivot resistance, the one-month high, and a declining medium-term average, all within seventy cents. The 50-day at 83.34 caps the extension case, and it is still falling, its price change over the window minus 11.61, so it will bleed lower into the week and tighten the ceiling.
Momentum is strong but hot, and the split between the two readings is the whole caution. The 14-day relative strength index at 56.56 is neutral-bullish with room to run, and the 9-day at 66.17 approaches but has not reached overbought. The raw stochastics are the flashing light: 90.72 percent on the 9, 14 and 20-day windows simultaneously, readings that historically precede either a consolidation or a sharp one-day flush even inside strong trends. Trend strength confirms the move is real rather than chop: the 9-day directional index at 35.09 with the positive component at 36.78 overwhelming the negative at 13.88, and the 14-day at 24.38 across the threshold that separates trending from directionless. Yet the multi-indicator composite is more skeptical than the chart, an overall 8 percent buy across thirteen systems, with short-term indicators at 60 percent buy, medium-term mixed, long-term at hold, and the primary trend signal still registering sell, a legacy of the April-to-June decline the last five sessions have not yet reversed. Historic volatility near 48 percent annualized is roughly triple a normal crude environment.
"When crude rallies on war risk while gold falls, the market is pricing barrels, not Armageddon. That combination historically supports dip-buying rather than fading."
The market is long war premium, and it knows it
Supply is the entire story, and the escalation ladder is climbing on several rungs at once: renewed US strikes on Iran, Iranian attacks on commercial shipping, and a formal blockade of Iranian transits. There was no offsetting supply-relief headline Tuesday, which makes Wednesday's risk asymmetric around shipping-lane news. The demand side is quietly supportive rather than leading: gasoline closed up nearly 2 percent at a six-week high, evidence that refiners and blenders are bidding for physical barrels rather than crude rallying on a hollow financial bid. And the one de-escalation note of the day is the template for how fast this can turn. Late Tuesday, the proposed 20 percent Hormuz cargo fee was shelved in favor of pursuing trade deals, and crude faded from its highs within minutes on that single headline. The market is long war premium, and any credible off-ramp unwinds part of it immediately; conversely, a strike on export infrastructure or a full closure attempt would gap this market through every resistance level on the board.
The cross-asset tell is important and easy to miss. Gold actually fell about a third of a percent to near 4,055 while crude surged. When oil rallies on conflict and gold does not catch a haven bid, the market is repricing a specific commodity supply risk, not fleeing into safety broadly. The dollar index eased about a third of a percent to near 100.94, a mild tailwind, but nothing in the rates picture drove the move; this is a supply-risk repricing, not a macro-liquidity trade. The one slow second-order headwind: an extended crude advance at this pace feeds directly into inflation expectations and eventually back into rate pricing, which works against the demand side only if the rally sustains above the mid-80s.
The caveat: the data is a week old, and some of that short base has already covered into this move.
One mechanical wrinkle governs the week. CL carries no listed-options gamma surface comparable to the index proxies, so positioning reads through the physical complex rather than a dealer-hedging one, and the front-month structure is the item to watch. The August contract expires Tuesday July 21, only four sessions after Wednesday, with first notice two days later. Expiry-week flows, longs rolling to September and shorts covering rather than making delivery, tend to amplify front-month moves in whichever direction the market is already leaning, and they arrive with the market already stretched. Open interest near 131,842 in the front month against a 20-day average volume of 244,444 shows liquidity migrating toward September as the roll approaches, so intraday moves in August can run hotter than the headline flow justifies. Expect September to become the effective benchmark by Thursday or Friday.
The trade: buy the dip, respect the wall overhead
With funds underpositioned into a worsening supply environment, the play is to buy the first structural dip in a strong short-term trend rather than chase an overbought print into overhead confluence. The demand architecture beneath price is layered. The immediate shelf is tonight's reopen low at 79.67 to 79.59, where the 38.2 percent retracement coincides with the evening session low. Beneath it, 79.48 is Wednesday's daily pivot and the natural magnet for an early fade, with the 79.34 settlement directly under it. The deeper intraday demand zone runs 78.60 to 78.42, prior acceptance from Tuesday's regular session. The critical structural base is 77.70 to 77.74, where the first pivot support meets the 50 percent retracement of the full 52-week range; a daily close below that band would invalidate the short-term bullish structure and open 76.45 then 76.05.
Target 1 at 81.10 is the front edge of the board's most important supply zone, where the first pivot resistance, the one-month high at 81.27, the projected target at 81.54 and the 100-day average at 81.81 all stack within seventy cents; a decisive four-hour close through 81.85 clears the entire zone at once. Target 2 at 82.90 is the second pivot resistance at the doorstep of the low-83s band, where the one-standard-deviation reading at 83.45, the 50-day at 83.34 and the 50 percent retracement at 83.57 form a second dense supply wall. Target 3 at 84.55 is the third pivot resistance, an escalation-extension objective and a runner only; the two-standard-deviation reading at 85.15 sits just above, and only a genuine supply shock puts 87.47 in play this week. If the inventory report prints a large surprise crude build and price cannot reclaim 79.48 within an hour, stand down on fresh longs for the day regardless of zone.
The alternate is a fade of the failure at the 81.13 to 81.60 confluence, valid only on visible rejection, a long upper wick on a 15-minute bar or a failed retest, accompanied by de-escalation tone in the news flow. Enter 81.10 to 81.55, stop 82.95, targets the 79.48 pivot then 77.75, roughly 1:1.2 and 1:2.4 from an 81.30 entry with 1.65 of risk. Do not take this short while fresh escalation headlines are actively crossing. And stand aside around the inventory release from 10:25 to 10:45 Eastern, for fifteen minutes after any new strait attack headline in either direction, on fresh longs above 80.50 mid-range with no pullback structure, and entirely if the market opens gapped beyond 82.00. Reduce size generally: the front month is four sessions from expiry and a normal day is running near four dollars.
The one-ATR statistical band, 75.83 to 83.13 around the 79.48 pivot, contains all but the extreme prints of these scenarios.
Powerful momentum, underpositioned funds, and a supply story that is worsening. The catch: it is all one off-ramp headline from unwinding, into a wall of overhead resistance.
The complete data picture
Every level and reading from the Tuesday evening CL review. Prices are NYMEX WTI front-month (August) futures. Nothing rounded away. One sourcing note carried from the review: the news-feed commodity categories and the next-day economic calendar could not be confirmed on this run, so Wednesday's inventory-release timing should be verified before acting on it.
| Resistance (bottom to top) | Support (top to bottom) |
|---|---|
| 80.24 evening-session spike high, the level to reclaim to signal the advance resuming | 79.67 to 79.59 reopen-low shelf, where the 38.2 percent retracement (79.67) meets the session low |
| 81.13 first pivot resistance, anchoring the supply zone: one-month high 81.27, target 81.54, 100-day 81.81 within seventy cents (clears on a 4-hour close through 81.85) | 79.48 daily pivot; 79.34 settlement directly beneath |
| 82.91 second pivot resistance and the near edge of the one-SD resistance 83.45 | 78.60 to 78.42 deeper demand zone (prior acceptance); 78.42 the 80 percent raw-stochastic reference |
| 83.34 50-day average and 83.57 the 50 percent retracement of the 13-week range, a second dense supply band | 77.70 to 77.74 structural base: first pivot support meets the 52-week midpoint (a daily close below invalidates the bullish structure) |
| 84.56 third pivot resistance; 85.15 two-SD; 87.47 the 38.2 percent retracement from the 13-week high (supply-shock only) | 76.45 (14-day RSI midpoint) and 76.05 second pivot support; 75.23 one-SD; 74.27 third pivot; 73.53 two-SD; 5-day average 76.18 rising into the mid-76s |
A supply-driven surge with funds caught underweight, running straight into a falling medium-term wall.
See how AlgoIndex turns positioning and structure into systematic signals. Read today's S&P 500 note and last week's crude note.
View pricing


