
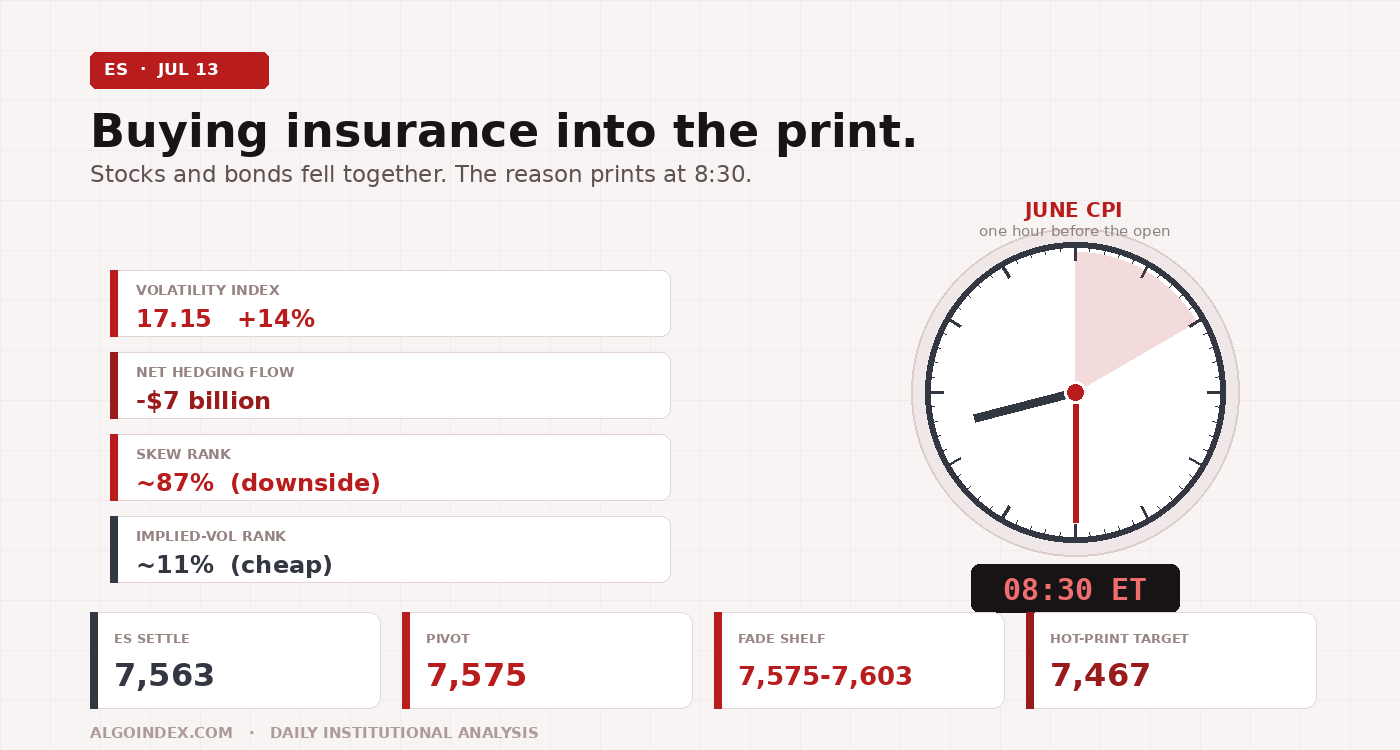
The S&P 500 E-mini closed Monday on the defensive near 7,563, down about 0.8 percent, but the story is not the size of the decline. It is what the market did around it: bought protection. The volatility index jumped 14 percent to 17.15, hedging flow closed at a net negative 7 billion dollars, and the shape of that flow, longer-dated calls sold and longer-dated puts bought, is institutions trimming upside and layering downside directly into Tuesday's 8:30 AM inflation print, one hour before the cash open. Stocks and bonds fell together while crude pushed above 78 dollars. The plan into Tuesday: fade rallies that stall into the 7,575 to 7,603 shelf once the post-report opening range forms, while respecting that a cool number and a reclaim of 7,575 flips the structure back toward 7,603 and 7,643. Cautiously defensive, inside an uptrend that is still fully intact.
One number sits in front of everything else. At 8:30 Eastern on Tuesday, one hour before the cash open, the June Consumer Price Index prints, and the entire pre-market complexion can reset in a single instant. Everything below is contingent on it. The market spent Monday getting ready.
Getting ready looked like this. The cash index shed 0.8 percent to close near 7,515, an orderly decline held to a tight 78 basis-point range, but the internal character shifted decisively toward caution. The volatility index finished at 17.15, up 14 percent, and the volatility-of-volatility gauge rose 9 percent to 95.28. That combination, a bid volatility complex without disorderly selling, says the market is paying up for protection ahead of a known event rather than reacting to fresh damage. You do not see the volatility index climb 14 percent on a 0.8 percent down day unless participants are buying insurance for something they can see coming.
A fade of strength into resistance, not a directional short into support. The longer-term uptrend is fully intact above every major average.
A corrective pause, not a top
Read the daily structure and the pullback looks small. The contract sits only about 1.9 percent beneath its 52-week and 13-week high at 7,693.75, with the one-month high at 7,648.75 and the one-month low at 7,357.25 well beneath current price. This is a market that has consolidated its gains in the upper quartile of its recent range rather than surrendered them. Monday's close beneath the 5-day average at 7,569.65, the first in several sessions, is a short-term loss of momentum, but price remains comfortably above the 20-day average at 7,531.02, which keeps the intermediate trend pointed higher. The profile is a corrective pause inside an uptrend.
The moving-average stack makes the point unambiguous. The 5-day at 7,569.65 sits just above the market now, a short-term ceiling the contract must reclaim to re-establish upside momentum. Everything below it is stacked in proper bullish order: the 20-day at 7,531.02, the 50-day at 7,516.92, the 100-day at 7,212.38 and the 200-day at 7,099.08, the last of which sits more than 6 percent beneath spot. The year-to-date average at 7,171.56 underscores the distance travelled, with price up roughly 8 percent from that mean. A short-term wobble against a firmly rising longer-term trend.
On the four-hour and swing view, the market has carved a lower high beneath the 7,620 to 7,650 zone and is probing the underside of its recent balance area. The swing pivots that matter are the 7,620 shelf on the upside, which capped the recent advance, and the 7,527 to 7,507 band on the downside, where the first and second standard-deviation supports converge. Extension work places near-term references at 7,620.74 above and 7,552.63, 7,544.62 and 7,476.51 below, which identifies 7,544 to 7,552 as the immediate battleground. Momentum on the swing timeframe has rolled from up to sideways, exactly the balance a high-impact release is designed to resolve.
The oscillators corroborate the pause. The 14-day relative strength reads 52.03, squarely neutral and far from overbought, with the 9-day at 50.91. The faster stochastic is still elevated, the 14-day percent-K at 80.91 above a percent-D at 85.36, which says very short-term momentum is stretched even as the broader oscillators reset. The most telling reading is the directional-movement system: the 14-day average directional index sits at just 16.01, beneath the 20 line that separates trending from non-trending conditions, with the negative directional line at 18.23 slightly above the positive line at 16.20. In plain terms, a low-conviction, range-bound market with a marginal downside tilt. The multi-indicator composite still reads a net-constructive 72 percent buy, led by a positive trend-following signal, even as several short-term components have flipped to neutral.
Stocks and bonds fell together. That is the tell.
Two forces set Monday's tone, and neither is ordinary. The first was a renewed standoff between the United States and Iran near the Strait of Hormuz, which lifted crude oil above 78 dollars and dragged equities and bonds lower together. That pairing is unusual and it is the whole message. Stocks and bonds normally move apart on a growth scare, bonds catching a bid as equities fall. When they decline in tandem while oil rises, the market is not pricing a growth scare. It is pricing an inflationary risk event, the fear that an energy supply disruption reignites inflation just as it was cooling, which would keep policy tighter for longer and punish stocks and bonds at the same time.
Stocks down, bonds down, oil up, volatility up. That is the fingerprint of an inflation risk event, not a simple selloff.
The second force was a heavy selloff in the semiconductor complex, led by a 9 percent decline in a major South Korean memory maker and a 4 percent drop in the chip-sector proxy. Because index gains have leaned heavily on a narrow group of large technology names, weakness there carries outsized weight for the broad index. Breadth deteriorated as the technology and semiconductor groups led lower while defensive and energy-sensitive areas found relative support on the oil move, the characteristic rotation of a late-cycle risk reassessment: money stepping back from the highest-beta leadership and into areas insulated from, or benefiting from, the energy shock. Until the semiconductor complex stabilizes, rallies in the broad index are likely to be met with supply. The earnings calendar is the potential circuit-breaker: a major lithography supplier reports July 15, a leading foundry July 16, and the largest technology names begin the following week. Options-flow analysts have explicitly framed another round of strong technology earnings as the most likely rescue should the inflation and geopolitical backdrop turn benign.
"All the ingredients for a sharp downside event are present, and only a trigger is missing, whether Iran, the inflation data, or an earnings miss."
Long gamma holds it down. Low correlation could let it go.
The underlying index options market is the primary flow surface for the E-mini, and it is sending a coherent, cautious message. Real-time hedging flow finished at a net negative 7 billion dollars, having been dragged as low as negative 9 billion during the session before recovering into the close. The composition matters more than the headline: roughly 3.5 billion of longer-dated call selling paired with 3.5 billion of longer-dated put buying. That is not panic. It is structured de-risking, upside lightened and protection layered directly into the following morning's data. Put volume outpaced call volume on the day, and the put-to-call open-interest ratio stands at 1.26, both consistent with a cautious posture.
Against that caution sits a stabilizer. Dealers remain net long gamma, with call gamma at 8.63 billion against put gamma of negative 2.63 billion. When dealers are long gamma they hedge against the move and dampen it, which is why realized movement stayed contained despite the headline barrage. During Monday's session the 7,500 support and 7,560 resistance held cleanly, validating the dealer-positioning map. But the stabilizer has a crack in it: single-stock correlation sits at two-year lows, meaning the index has been held together by dispersion rather than broad strength. That structure absorbs single-name shocks well and correlated macro shocks poorly, and it can fail quickly if positions shift after the data. Long gamma dampens a move. It does not prevent one.
One-month implied volatility sits near 12 percent. High skew rank plus low implied-volatility rank means downside protection is in heavy demand yet historically cheap, which keeps the risk-reward of hedging attractive and the market primed for a resolution.
The dealer-positioning levels frame the session cleanly. Resistance sits at 7,560, 7,575 and 7,600 in the underlying index. The pivot at 7,480 separates the bullish and bearish environments. The support base is stacked at 7,520, 7,500, 7,450 and 7,400. The upside case is not dead: a benign inflation number plus strong technology earnings could carry the index toward the 7,600 to 7,625 zone into Friday's monthly options expiration, which analysts mark as the likely ceiling. But the honest read of Monday's flow, dated the evening note at 5:23 PM ET, is that institutions spent the day preparing for the other outcome.
The trade: fade the shelf, respect the print
The setup is cautiously defensive below the 7,575 pivot and two-sided around the inflation reaction. The rationale stacks up on one side: the contract closed near its lows beneath the 5-day average, hedging flow shows institutions de-risking and buying protection, the volatility complex is bid, and the index sits below its prior-day close inside a non-trending, marginally negative directional environment. That sits against an intact longer-term uptrend, which is why this is a fade of strength into resistance, not a directional short into support.
A sustained reclaim and hold above 7,575 invalidates the short and flips the near-term structure constructive; a stabilization in the semiconductor complex would neutralize the bearish lean on its own. And the 8:30 inflation report supersedes every technical level on this page at the open. No entries before 9:45 Eastern, and let the initial reaction settle before committing, because the first fifteen minutes of a data-driven session are especially prone to a fake-out that reverses. The opening range read is the first honest signal of the day.
The higher-probability path if the number is cool is the long. On a decisive reclaim and hold above 7,575 following a benign print, buy toward 7,603 and then 7,643 with a stop below 7,555, provided the technology complex steadies. Stand aside entirely if the inflation reaction produces a large gap that leaves price stranded mid-range with no clean level test; wait for the opening range to define the day. Stand aside through the first fifteen minutes on any outsized reaction, and do not chase the initial spike in either direction.
The base case is a two-sided session that opens with an outsized reaction, retraces part of it into the opening range, then trends toward the level the inflation number validates.
The uptrend is intact and the dealers are long gamma. But the market spent Monday buying insurance, and the reason prints at 8:30.
The complete data picture
Every level and reading from the Monday evening ES review. Levels are September E-mini futures prices, with cash-index equivalents noted where the review provides them. Nothing rounded away.
| Resistance (bottom to top) | Support (top to bottom) |
|---|---|
| 7,575 pivot (cash about 7,527): first hurdle bulls must reclaim to neutralize the defensive lean | 7,563 Monday settlement (cash about 7,515): the line in the sand for the evening |
| 7,599 to 7,603 first computed resistance and one-SD band (cash about 7,551 to 7,555): dense shelf aligned with dealer resistance near 7,560 | 7,535 first computed support (cash about 7,487): reinforced by the 40-day average at 7,536 |
| 7,620 to 7,625 recent swing high and three-SD band (cash about 7,572 to 7,577): upper edge of the balance area, the likely ceiling into Friday under benign conditions | 7,527 to 7,512 first and second-SD supports (cash about 7,479 to 7,464): aligned with the 18-day average at 7,521 and the dealer support base near 7,520 to 7,500, the primary downside decision zone |
| 7,643 second computed resistance (cash about 7,595): aligns with dealer resistance near 7,600, a magnet on a strong upside resolution | 7,507 second computed support (cash about 7,459): a deeper base that comes into play on a hot print |
| 7,671 third computed resistance (cash about 7,623): extreme upside target for the week, only on a decisively cool surprise | 7,467 third computed support (cash about 7,419): lower extreme for the week, aligned with the support base near 7,450, on a hot surprise and a break of the dealer-gamma pivot |
An intact uptrend, a defensive close, and one number that decides the morning.
See how AlgoIndex turns dealer positioning and hedging flow into systematic signals. Read Friday's ES note and the pillar on how dealer call and put walls behave.
View pricing


