
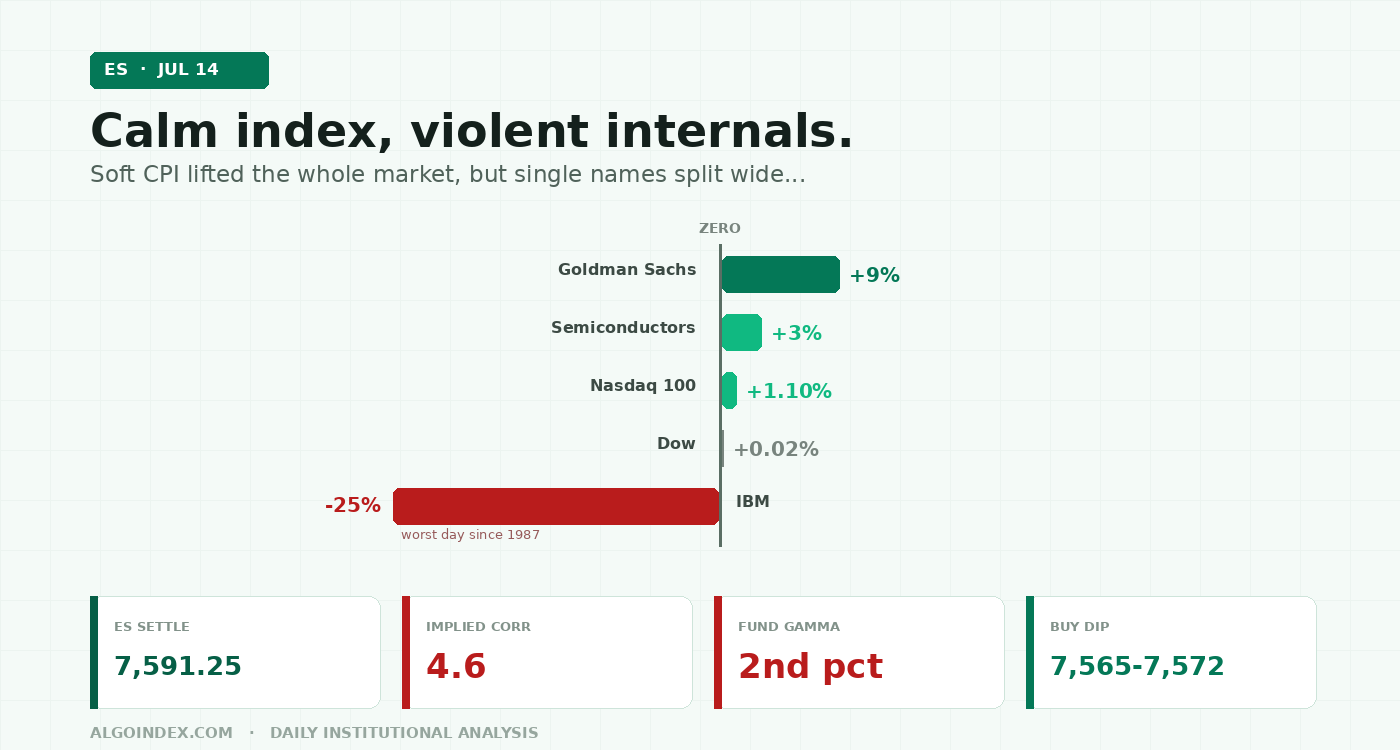
June inflation fell 0.4 percent on the month, the first monthly drop in six years, and it gutted a market that had been pricing rate hikes rather than cuts. The S&P closed higher a second day, cash at 7,543.59 and September E-mini at 7,591.25, with stocks and bonds rallying together. But the index-level calm hid violent single-name action: Goldman Sachs soared 9 percent to an all-time high while IBM collapsed 25 percent, its worst day since 1987. Beneath it, one-month implied correlation closed at 4.6, deep in spasm territory, and the exchange-traded-fund hedging channel is carrying heavily negative dealer gamma. Wednesday brings June PPI and the first big chip earnings. The plan: buy a post-PPI dip into 7,565 to 7,572, stop below 7,543, target 7,605 then 7,626. Constructively neutral-to-bullish, moderate conviction.
The whole day belonged to one number. Headline consumer prices fell 0.4 percent in June against an expected 0.1 percent decline, the first monthly drop in six years, dragging the annual rate to 3.5 percent from 4.2 percent. Core prices were flat on the month, 0.0 percent against 0.2 percent expected, with the annual core rate easing to 2.6 percent. In most cycles a soft inflation print is pleasant. In this one it was seismic, because the debate coming in was not about when the Fed cuts but whether it hikes. Short-term rate futures had priced roughly a 50 percent chance of a July hike and about 43 basis points of tightening by year-end. The print gutted those bets in an instant. The 10-year yield fell 4 basis points to 4.58 percent, the dollar weakened, and both stocks and bonds rallied together.
Buy the dip after PPI rather than chase strength into the 7,605 to 7,626 resistance band. A hot PPI core or a Gulf escalation stands the plan down.
Calm on the index, violence underneath
Look only at the index and Tuesday was a quiet, constructive day: cash SPX held a remarkably tight 58 basis-point range. Look at the single names and it was a bloodbath in both directions. Bank earnings opened the season strong: Goldman Sachs beat and soared 9 percent, more than double its implied move, closing at an all-time high, with JPMorgan, Bank of America and Wells Fargo all beating too. Semiconductors rallied about 3 percent as the Korean memory complex rebounded, driving the Nasdaq 100 up 1.10 percent. Against all that, IBM collapsed 25 percent on a sales miss, its worst single-day decline since 1987, dragging the software group broadly lower. The Dow finished barely positive at plus 0.02 percent.
A market making highs on two sectors and seven stocks works until the day it does not. Single-name misses are being punished at historic scale.
The mechanism holding the index still was mechanical. A roughly 7,000-lot same-day-expiry iron condor, short strikes at cash 7585 and 7590 above and 7470 and 7475 below, compressed intraday movement and effectively defined the day, pinning cash SPX between its short strikes and squeezing realized range to 58 basis points. That pin is a Tuesday artifact. Friday's monthly option expiration removes it, and expiration weeks historically widen the distribution of outcomes for the following week precisely because the stabilizing structures roll off.
"All of the ingredients for a nasty spasm and market correction, but we need a trigger." Wednesday supplies two of the three named candidates at once: macro data and earnings.
The surface says strength. The internals say fragility.
The bullish surface is real. Price sits above every major moving average, the daily stack bullishly ordered and entirely below spot: 5-day 7,578.40, 20-day 7,533.21, 50-day 7,517.79, 100-day 7,212.82, 200-day 7,099.30. ES trades 4.00 percent above its 50-day and 11.27 percent above its 200-day, up 8.55 percent year to date. Dealer positioning on the index itself is mildly positive, index gamma tilt at 1.094, and earnings are delivering. The 14-day relative strength index at 55.36 is squarely mid-zone with room in both directions.
The fragile internals sit right beneath that surface. One-month implied correlation closed at 4.6, far below the 8 threshold the desk flags as spasm risk, which means the calm is bought with historically extreme dispersion, single names moving in opposite directions and cancelling out at the index level. That read comes from the 4:00 PM ET post-close dealer note, published 5:26 PM ET. The exchange-traded-fund hedging channel carries heavily negative dealer gamma, at the 2nd percentile, negative 528 million dollars in notional by one screen. Positive index gamma with negative fund gamma is a specific and dangerous combination: the index channel damps a move while the fund channel amplifies its first leg. And the trend engine is idling. The 14-day average directional index sits at just 16.23, with the negative directional line at 18.45 slightly above the positive at 15.40, a rangebound, low-trend-energy market rather than an advancing one. The multi-indicator composite reads 56 percent buy overall, but the short-term sleeve is only 20 percent buy against 75 and 67 percent for the medium and long-term sleeves. The long-term uptrend is intact; the short-term engine is idling.
Realized volatility stays subdued. The 14-day average true range is 94.70 points, or 1.25 percent of spot, and nine-day historical volatility is just 8.50 percent. One-month realized at 12.76 percent sits below one-month implied at 13.83 percent, with implied-volatility rank at only 22.5 percent. Options pricing implies a next-session move of roughly 0.71 percent, projecting an approximate one-day band of 7,537 to 7,645 from the 7,591 anchor, with the one-standard-deviation model framing 7,556.88 to 7,625.62. The asymmetry is the point: with correlation this depressed and the fund channel in negative gamma, a range break, especially downward, tends to travel faster than these averages suggest.
Wednesday hands the market two of its three triggers
This remains a hike-risk environment, which inverts the usual data reflexes. Governor Waller warned on Sunday that he sees an equally likely scenario that stricter policy will be required, and that a hike may be needed if this week's core inflation ran hot. Tuesday's print defused exactly that scenario. New Chair Kevin Warsh gave his first House testimony, keeping to a low-guidance, resilient-economy message, with Barr, Goolsbee, Cook and Bowman also speaking without disturbing markets. Now the question passes to June PPI at 8:30 Eastern Wednesday. Forecasts call for a flat headline month, 0.0 percent against the prior month's outsized 1.1 percent jump, with the annual rate easing to 6.2 percent from 6.5 percent. But core PPI is expected at 0.3 percent on the month with the annual core rate actually rising to 5.2 percent from 4.9 percent, exactly the second-round-effects question Waller conditioned his hike scenario on. A soft print completes the disinflation pair and cements the dovish repricing. A hot core print reverses it within 24 hours of the market having priced it out, an asymmetric setup given how fully Tuesday's relief rallied risk.
The second trigger is earnings. The financials-led open matters beyond financials: the desk has identified another round of large technology-earnings upside as the savior of this market, and banks clearing the bar keeps that narrative alive until the chip complex reports. That test begins Wednesday with ASML before the US open, the first true read on the artificial-intelligence capital-spending chain, and continues with Taiwan Semiconductor on Thursday, before the megacaps begin the following week. Options flow into those reports is aggressive, with chip-sector delta positioning at the 98th to 100th percentile of its history. The third candidate, the Persian Gulf, simmers in the background: the US has reimposed a blockade of Iranian shipping through Hormuz, the ceasefire was declared over on July 10, more than 20 US warships operate across the region, and a projectile reportedly struck Qeshm Island after Tuesday's close. Crude rose but held below 80 dollars, yet total US crude inventories including the strategic reserve sit at their lowest since 1984, so any genuine disruption transmits to prices, and to the Fed calculus, very quickly.
Speculative futures accounts are net short the E-mini as of July 7, 244,103 long against 286,994 short, a mild contrarian tailwind that fuels rallies as shorts pay up on strength.
The trade: buy the dip after PPI, not the strength before it
Trend, a seasonally strong dealer support stack and a freshly de-fanged hike scare argue for buying the first post-PPI dip into structural support rather than chasing the 7,600 shelf. The support architecture beneath price is dense. First real demand is 7,565 to 7,572, the first dealer-model support at a cash 7,520 equivalent plus the 9-day moving-average crossing at 7,570.38. Beneath it sits the critical shelf at 7,542 to 7,546: the primary gamma concentration strike at 7,545.55, the computed first pivot support at 7,543.92, the two-standard-deviation band bottom at 7,542.64 and Tuesday's full-session low, four independent supports inside four points. Losing that shelf changes the session character. Below it, 7,516 to 7,527 stacks the dealer gamma flip level at 7,516.55, the desk's risk pivot at a cash 7,480 equivalent, the 18-day zone at 7,526.93 and the 50-day at 7,517.79; beneath this band dealer hedging flips from damping to accelerating and the desk's own bull-bear line is broken.
Target 1 at 7,605 is the dealer resistance and prior-day-high shelf. Target 2 at 7,626 is where the second dealer resistance, the first pivot resistance at 7,626.17 and the one-standard-deviation top at 7,625.62 stack within six points. Target 3 at 7,645 is the call wall at 7,645.55 sitting right on the one-month high at 7,648.75, the single most important upside magnet and cap into Friday's expiration. Three overrides stand the long down: a hot PPI core at or above plus 0.4 percent on the month, a Gulf military escalation, or an ASML guidance cut severe enough to gap semiconductors lower. The alternate is a one-shot fade of the 7,620 to 7,626 confluence if price arrives there extended on a post-soft-PPI spike and stalls with flat hedging flow, stop 7,647, targets 7,591 then 7,565.
Path C is the tail the desk keeps warning about: thin summer books plus negative fund hedging, an afternoon phenomenon by nature. Honor stops after 14:00 Eastern.
Soft inflation bought the relief. Extreme dispersion and Friday's expiration are the bill, and PPI decides when it comes due.
The complete data picture
Every level and reading from the Tuesday evening ES review. Levels are September E-mini futures prices, with cash-index equivalents noted where the review provides them at the roughly plus 46-point basis. Nothing rounded away.
| Resistance (bottom to top) | Support (top to bottom) |
|---|---|
| 7,592 to 7,600: the new session's early high and repeatedly sold late-day supply shelf, caps tonight's Globex | 7,583 tonight's Globex low, backed by the 7,578 to 7,579 computed daily pivot |
| 7,605 to 7,610: first dealer resistance (cash 7,560) plus the prior-day-high spike where the RTH rally was capped | 7,565 to 7,572: first dealer support (cash 7,520, ES about 7,565.5) plus the 9-day crossing at 7,570.38 |
| 7,620 to 7,626: second dealer resistance (cash 7,575), first pivot resistance 7,626.17, one-SD top 7,625.62 within six points | 7,542 to 7,546: primary gamma concentration strike 7,545.55 (cash 7,500), first pivot support 7,543.92, two-SD band bottom 7,542.64, the session low, four supports in four points |
| 7,645 to 7,650: call wall 7,645.55 (cash 7,600) on the one-month high 7,648.75, the dominant upside magnet-and-cap into expiration | 7,516 to 7,527: dealer gamma flip 7,516.55 (cash 7,471), risk pivot (cash 7,480, ES about 7,525.5), 18-day 7,526.93, 50-day 7,517.79; below here hedging accelerates |
| 7,661 second pivot resistance; 7,694 (52-week high 7,693.75); 7,708 third pivot resistance | 7,496 second pivot support; 7,495 (cash 7,450); 7,462 third pivot support; 7,445 (cash 7,400); put wall 7,345.55 (cash 7,300) |
Soft inflation lifted the whole market. Extreme dispersion means the calm underneath is borrowed.
See how AlgoIndex turns dealer positioning and hedging flow into systematic signals. Read Monday's CPI-eve ES note and the pillar on how dealer call and put walls behave.
View pricing


