At 2:47 PM on Thursday, March 19, ES futures tagged 6,695 and stopped. Not because of a headline. Not because a fed official opened his mouth. Because 48,000 contracts of IWM put spreads had just printed at the 235/240 strikes, and somewhere on a dealer desk in lower Manhattan, a risk engine recalculated its gamma exposure and started selling. Price reversed 40 points into the close. The S&P 500 finished down 0.27% on a day that felt like it should have been green.
That reversal mattered less for what it did to Thursday’s P&L and more for what it revealed about Friday’s setup. The bounce from Wednesday’s 103-point FOMC capitulation candle was mechanical. Short-covering, not conviction. Options flow confirmed it: real-time hedging data showed approximately $2 billion in net positive delta on the session, but almost all of it came from 0DTE put sellers collecting premium at the 6,530 SPX strike. When the flow flattened while price kept pushing higher, the divergence said everything. Dealers were buying. Everyone else was selling.
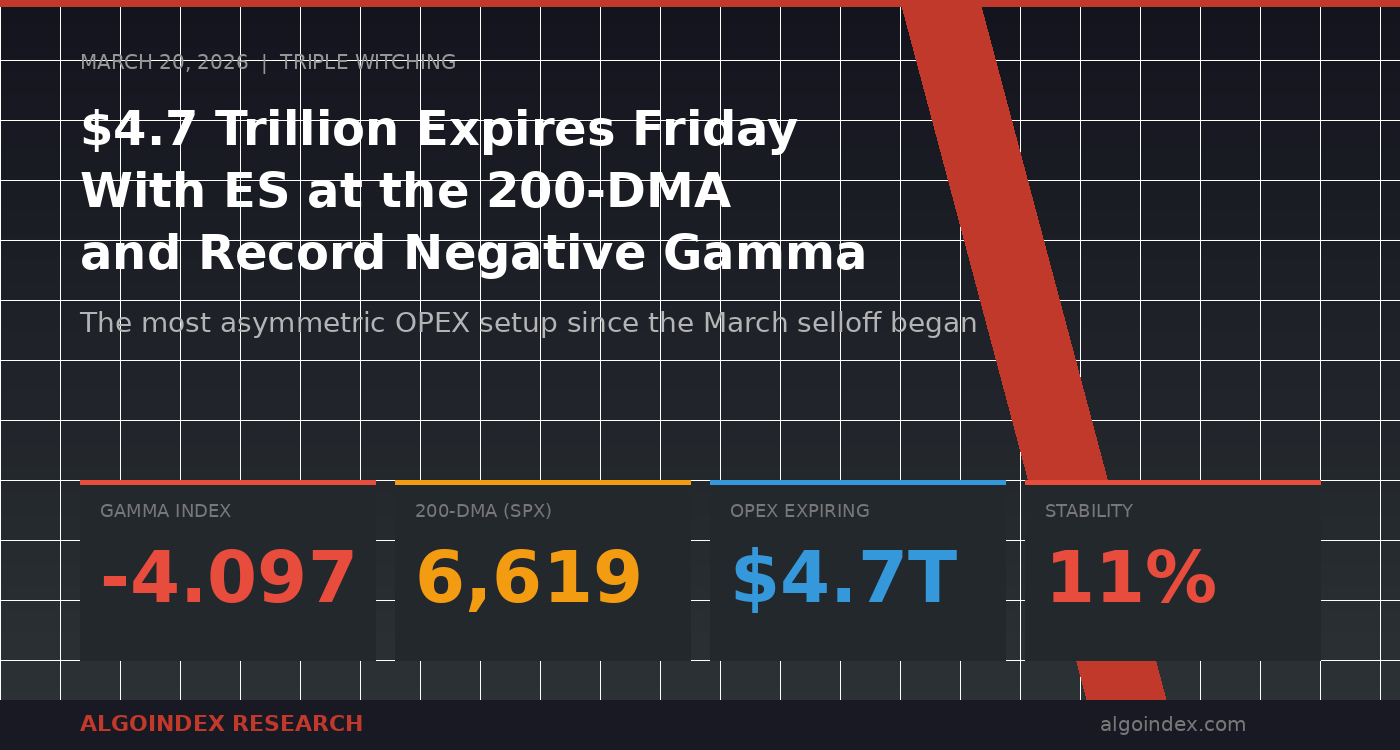
Friday is March monthly OPEX. Triple Witching. Roughly $4.7 trillion in options expire, with puts outnumbering calls 57% to 43%. And ES sits directly on top of the most consequential technical level in the entire S&P 500 complex: the 200-day moving average at 6,619 SPX.
That combination of structural fragility, extreme dealer positioning, and a single technical level that every institutional algorithm on the planet is watching creates the most asymmetric session setup since the March selloff began two weeks ago. What happens at the 200-DMA on Friday determines whether this correction is a 7% pullback that bounces or the start of something institutional desks have been quietly positioning for since January.
The 200-DMA Is Not Just a Line on a Chart
Every moving average gets treated as support or resistance by some percentage of market participants. The 200-day is different. It functions as a binary trigger for an entire class of systematic strategies that manage trillions in aggregate.
CTA trend-following funds use the 200-DMA as a positioning filter. When the S&P trades above it, they allocate long. When it breaks below, they reduce or flip short. The rebalancing is not discretionary. It fires automatically when the condition is met, and the resulting flow is large enough to move the index by itself.
Risk parity portfolios use a similar framework. A sustained close below the 200-DMA increases realized volatility estimates, which triggers mechanical equity allocation reductions. These funds don’t care about earnings, geopolitics, or the Fed. They care about the statistical properties of the return distribution, and a 200-DMA break changes those properties.
SPX closed Thursday at 6,606, thirteen points below the 200-DMA at 6,619. ES in Globex sat at 6,679, roughly at the equivalent level when you account for the futures-cash basis. This is not a comfortable distance in either direction. It is close enough that a 30-point move Friday morning decides whether the systematic selling cascade activates or whether short-covering lifts the index back above the trigger.
Wednesday’s 103-point FOMC candle already pushed price through the 5-day, 20-day, 50-day, and 100-day moving averages. The 200-day is the last one standing. Every other structural support has already failed on the first test.
Gamma at -4.097: What the Deepest Negative Reading of March Means for Friday
Options dealers don’t choose how they hedge. Their gamma exposure dictates it. When gamma is positive, dealers buy dips and sell rallies, creating a natural stabilizer that compresses volatility. When gamma is negative, the mechanics reverse. Dealers sell into declines and buy into rallies, amplifying every move beyond what fundamentals alone would justify.
The gamma index on SPX closed Thursday at -4.097. That is the deepest negative reading of the entire March selloff, worse than Wednesday’s FOMC session, worse than the initial breakdown from 7,000. Gamma notional sits at negative $1.273 billion.
On a normal Friday, this would mean wider-than-average ranges. On Triple Witching, it means something more specific. The expiration of $4.7 trillion in options removes roughly $1 billion in gamma exposure from the market in a single session. That gamma was providing a support base, however fragile, at certain strike prices where dealers had concentrated hedging positions. When those options expire, the hedging positions unwind, and that support base disappears.
Real-time gamma visualization confirmed the setup Thursday. The heatmap showed entirely pink and red coloring below 6,700 SPX, with zero positive gamma anywhere near the current price. The stability reading at 11% is near the lowest possible, indicating conditions are compressed for an outsized directional move. The 0DTE gamma exposure concentrated at the 6,600 and 6,650 strikes, which means those levels will act as magnets during Friday’s session until the options expire and the gravitational pull vanishes.
The Institutional Tell: Where the Largest Bets Are Concentrated
Institutional options flow for Friday’s expiration reveals a clear directional lean. The single largest trade expiring March 20 is a $112 million delta put position at the SPX 7000 strike, opened as a put spread. That trade was profitable the moment it was placed, and its expiration Friday releases the dealer hedging that came with it.
Closer to the current price, put spreads at the 6,710 and 6,700 SPX strikes carry combined delta exposure of negative $16 million. These positions sit directly at ES resistance, which means the institutional bet and the technical level are aligned. When options flow and chart structure agree on a level, the probability of that level holding as resistance increases measurably.
But the real signal is in the longer-dated positioning. A 10,450-contract put roll at the SPX 6,770 strike for March 31 expiration tells you institutions are not just hedging Friday. They are positioning for continued weakness through quarter-end. A separate 6,522-contract long strangle at the 6,375 SPX strike for April 2 expiration is deep downside protection that only makes sense if the buyer expects SPX to trade 230 points lower within two weeks.
The quarterly collar rebalance from the largest institutional desk on Wall Street places its put strike at 6,475 SPX for March 31. That level sits 131 points below Thursday’s close. Options flow analysis noted that their own desk is adding put butterflies at the 6,500-6,475 zone into month-end. When the data provider puts its own capital behind the same thesis it is publishing, the signal carries weight.
Thursday Close
What Friday’s Session Looks Like From Here
The FOMC aftermath removed the fundamental bid. Wednesday’s hawkish hold at 3.75%, combined with raised PCE projections to 2.7% and a dot plot showing only two cuts pushed to late Q4, killed the rate-cutting narrative that had supported equity multiples since January. Hot PPI at 0.7% monthly versus 0.3% expected confirmed the inflation persistence that Powell flagged. Those conditions do not reverse on a Friday with no major US economic data on the calendar.
Geopolitical risk adds a layer of binary uncertainty. Netanyahu discussing a ground component to the Iran campaign, the Strait of Hormuz still under strain after three weeks of fighting, and energy supply chains showing stress from India to Vietnam all create headline risk that moves ES 30 to 50 points on thin OPEX liquidity. Thursday evening brought a potential offset: Netanyahu suggesting the conflict could end sooner than expected. But “sooner than expected” and “resolved” are different words, and the market has learned that lesson repeatedly over the past three weeks.
Record money market inflows at $7.856 trillion confirm what the options data already showed. Institutions are hoarding cash, not deploying it. VIX at 24.05 pulled back below the 25 threshold that triggers systematic risk-off protocols, but it is one bad headline away from recrossing it. Market breadth improved Thursday from Wednesday’s extreme negative readings, but improvement from a -1,642 advance-decline number to -422 is like saying the patient’s fever dropped from 104 to 102. Better is not good.
The high-probability path for Friday follows the OPEX template that has played out in negative gamma environments before. A morning bounce on short-covering lifts ES toward the 6,695-6,710 zone, where Thursday’s high, the overnight high, and concentrated put positioning at the 6,710 SPX strike create a resistance ceiling. By mid-morning, gamma unwind from the massive March expiration begins pulling price lower. The afternoon grind targets the 6,640-6,660 range, with the options-implied move suggesting ES could reach as low as 6,587 if selling accelerates.
Key Levels for Friday
Resistance
| 6,710-6,720 | Thursday bounce high, broken 4H structure level. Short invalidation above 6,720. |
| 6,732 | Computed pivot R1. First significant pivot resistance. |
| 6,786-6,789 | gamma flip level level, computed pivot R2. Above this, dealer hedging flips supportive. Major resistance. |
| 6,853 | volatility inflection level level. Conditions change above here. Not expected this session. |
Support
| 6,665-6,672 | 200-DMA zone. Critical long-term support. Break below triggers institutional selling cascade. |
| 6,643-6,650 | VWAP, computed pivot S1 zone. Thursday’s session attractor. First meaningful support. |
| 6,620-6,632 | Value area low, point of control, computed pivot S2. Major structural support. |
| 6,587-6,600 | Options-implied 1-day move low. Downside target for Friday. |
| 6,553-6,567 | Put Wall zone, computed pivot S3. Massive put open interest. Institutional target nearby at 6,475 SPX. |
Primary Setup
Short from 6,695-6,710 (ES) | Stop 6,730 | Targets: 6,650 / 6,620 / 6,590
Entry window: morning bounce between 9:45 and 10:30 AM as short-covering lifts price into the PDH/ONH resistance zone. Stop sits above the broken 4H structure level and pivot R1. First target at VWAP/S1 confluence captures the OPEX gamma unwind. Second target at Thursday’s POC/S2 represents the full afternoon grind. Third target at the options-implied 1-day move low is the stretch goal if a geopolitical headline or 200-DMA break triggers the systematic selling cascade.
Based on historical backtesting, negative gamma environments with OPEX catalyst produce directional moves exceeding the implied range 60% of the time.
The 200-DMA sits right in the middle of that range, waiting for its verdict.
Past results are not indicative of future performance. This content is for informational and educational purposes only and does not constitute financial advice or a recommendation to buy or sell any security or futures contract. For our full performance disclosure, visit algoindex.com/performance-statement.
AlgoIndex Research · algoindex.com · Start your free trial
Related: We examined the broader correction risks well before this selloff materialized. See our detailed framework: Is a Major Market Correction Really a Concern?
Join the Discussion
Connect with other ES futures and SPY options traders. Share setups, discuss levels, and get real-time market insights from our community.
Join AlgoIndex Trading CommunityFoundational guides
New to S&P 500 futures? Start with What Are ES Futures, the ES, NQ, MES & MNQ point value and contract specs, gamma exposure (GEX) explained, and market internals: TICK, ADD, VOLD and VIX.