
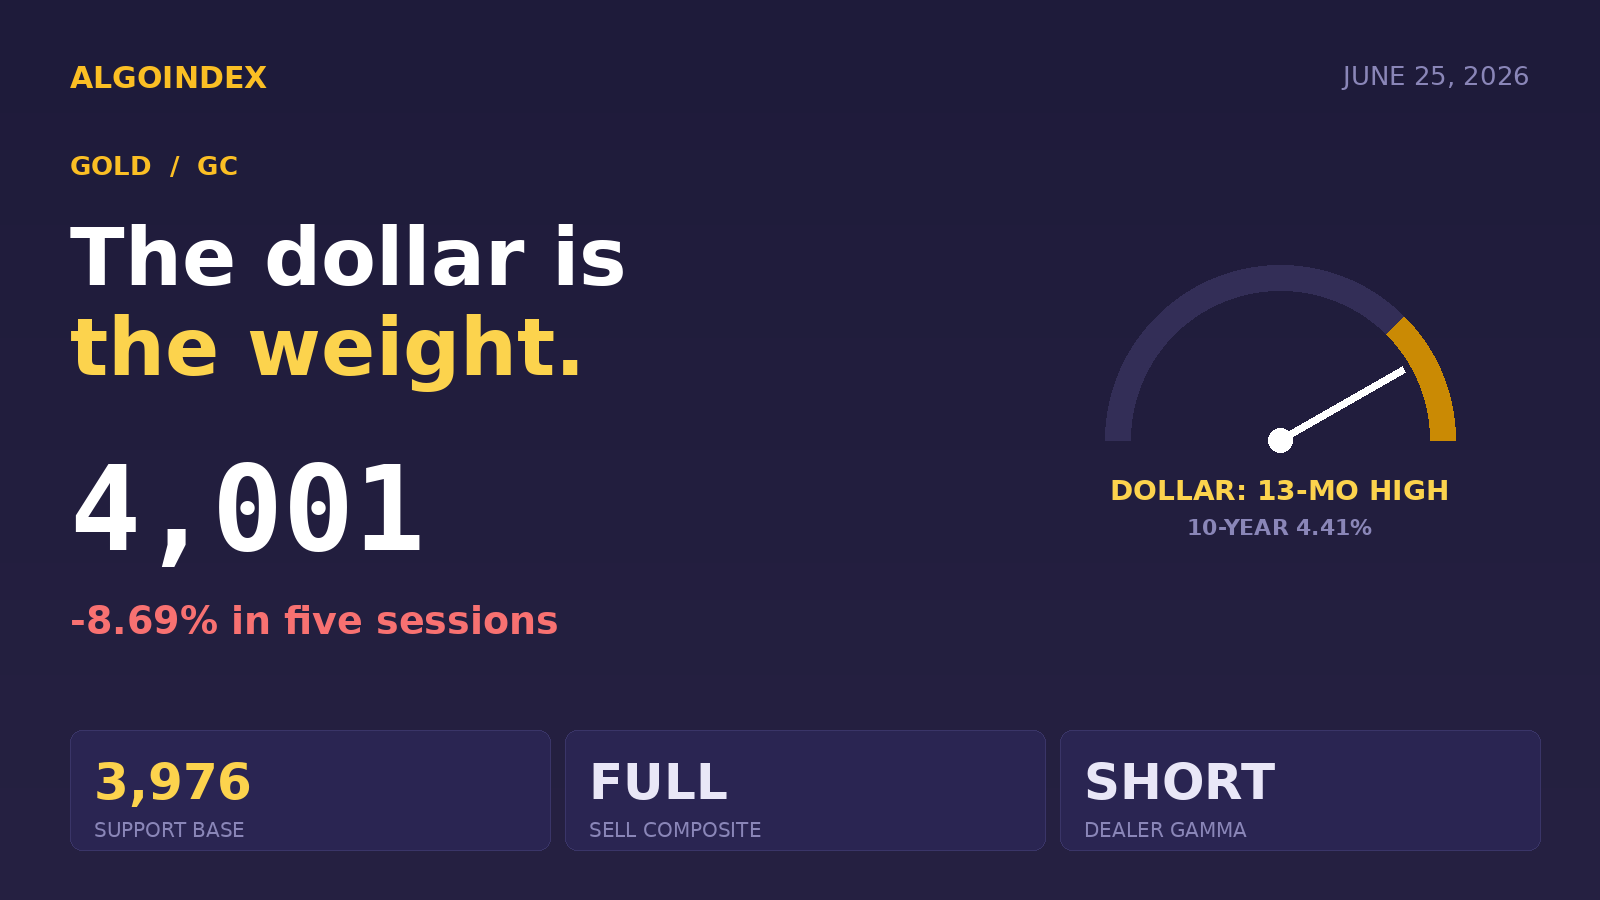
Gold's problem this morning is not fear, it is the dollar. The greenback has pushed to a fresh thirteen-month high on bets of tighter Federal Reserve policy, and that single force has dragged the metal down nearly 9 percent in five sessions, leaving it pinned directly on the support base that has held since spring.
The front-month contract trades near 4,001, just above the prior settle of 4,008.8, after an overnight session that ranged from 3,976.3 to 4,033.9. The decline is monetary, not geopolitical: a firmer dollar and elevated real yields, with the 10-year holding near 4.41 percent, have steadily compressed gold even as it sits roughly 30 percent below its 52-week high of 5,706. The technical picture is uniformly bearish on the longer horizon, with price below every major moving average and a multi-indicator composite that reads a full sell across all thirteen component studies. The one contradiction that matters is condition, not direction: the 14-day relative strength near 28.7 and stochastics in the single digits flag a deeply oversold market sitting on its one-month and thirteen-week base at 3,976.
The decisive variable is timed. The Federal Reserve's preferred inflation gauge, the core PCE price index, releases at 8:30 ET before the cash open, with the year-over-year reading expected near 3.4 percent versus 3.3 prior and the monthly near 0.31 percent versus 0.2. A hot print would reinforce the stronger-dollar, lower-gold theme and pressure the 3,976 base; a soft print would hand an oversold market the excuse for a relief rebound toward the 4,039 pivot. Markets price roughly a one-in-three chance of a Fed move at the July 28 to 29 meeting.
Detached from the entire average stack
Price is below every moving average, a strongly bearish alignment, and the first overhead average sits more than 120 points above spot. The 5-day is at 4,122.3, the 20-day at 4,316.2, the 50-day at 4,540.3, the 100-day at 4,759.4, the 200-day at 4,541.6, and the year-to-date mean at 4,773.4. That distance underlines how far price has detached to the downside and how much room exists for an oversold snap-back before any average is reclaimed. The directional system, by contrast, signals a powerful, intact downtrend: the 14-day directional index at 39.2 with negative movement at 34.2 dominating positive at 9.3, and the 9-day even stronger at 48.1.
Volatility is high and steady: the 14-day average true range is 123.2 points, about 3.10 percent of price, the average daily range is 123.1, and historic volatility reads near 31.7 percent. Around the current 4,001 reference, a one-range envelope spans roughly 3,878 to 4,124, with a tighter most-likely band of about 3,945 to 4,072. The dealer-positioning context, read through the gold-ETF proxy near 366.94, places the upper volatility-inflection level at 369, which maps to roughly the 4,030 to 4,040 area in gold terms and aligns neatly with the 4,033 overnight high and the 4,039 pivot, reinforcing that zone as the key overhead magnet.
Net-negative gamma favors the breakout
Dealer gamma on the proxy is net negative on both the call and put side, with call gamma near minus 101 million and put gamma near minus 232 million. A net-negative posture means dealers hedge in the direction of the move rather than against it, which reduces pinning and supports trend continuation once a level breaks. The one-month implied volatility near 23.4 percent and an implied one-day move near 1.5 percent frame the expected envelope. The practical read: positioning favors momentum follow-through on a decisive break of either 4,039 above or 3,976 below, not a quiet pin.
The conditional path is a counter-trend long, valid only on a soft core PCE and a defended 3,975 to 3,976 base after 9:45 ET, entering on a reclaim of 3,990 to 4,002 with a stop below 3,945 and targets at 4,033, the 4,039 pivot, then 4,072. The safe-haven premium is deflating on Middle East de-escalation, the volatility index sits subdued near 17.9 removing a cross-asset fear bid, and silver is softer too, confirming a complex-wide pullback. The base case is a two-phase session: data-driven volatility off 8:30, then a directional resolution of the 3,976 to 4,039 bracket during the 9:45 to noon window.
The complete data picture
For readers who want the full structure rather than the summary, here is the entire computed level map and the complete set of momentum, volatility, and positioning readings behind today's view.
| EXPECTED RANGE TODAY | |
| Low | roughly 3,920, toward 3,945 then 3,931 on a shelf break |
| Most-likely mid | near 4,001 (band 3,945 to 4,072) |
| High | roughly 4,072 on a soft print, toward the 4,039 pivot |
Path A bearish continuation 45%, Path B oversold bounce 35%, Path C chop 20%. Longer-horizon official and strategic buyers have historically re-engaged in the 3,800s to 3,900s.
Full session calendar. 08:30 US core PCE price index (YoY expected 3.4% vs 3.3% prior, MoM 0.31% vs 0.2%), headline PCE (4.1% YoY), final Q1 GDP (1.6%), durable goods (about -5%), personal income and spending, and initial jobless claims (225k vs 226k prior); 13:00 US 7-year note auction; 15:40 Fed's Williams; 18:30 Fed's Goolsbee. University of Michigan finals land Friday June 26.
AlgoIndex maps computed structure and dealer-positioning context every session. Review the performance statement, compare strategies on the pricing page, and grade every trade with the free AI Trading Journal.



