
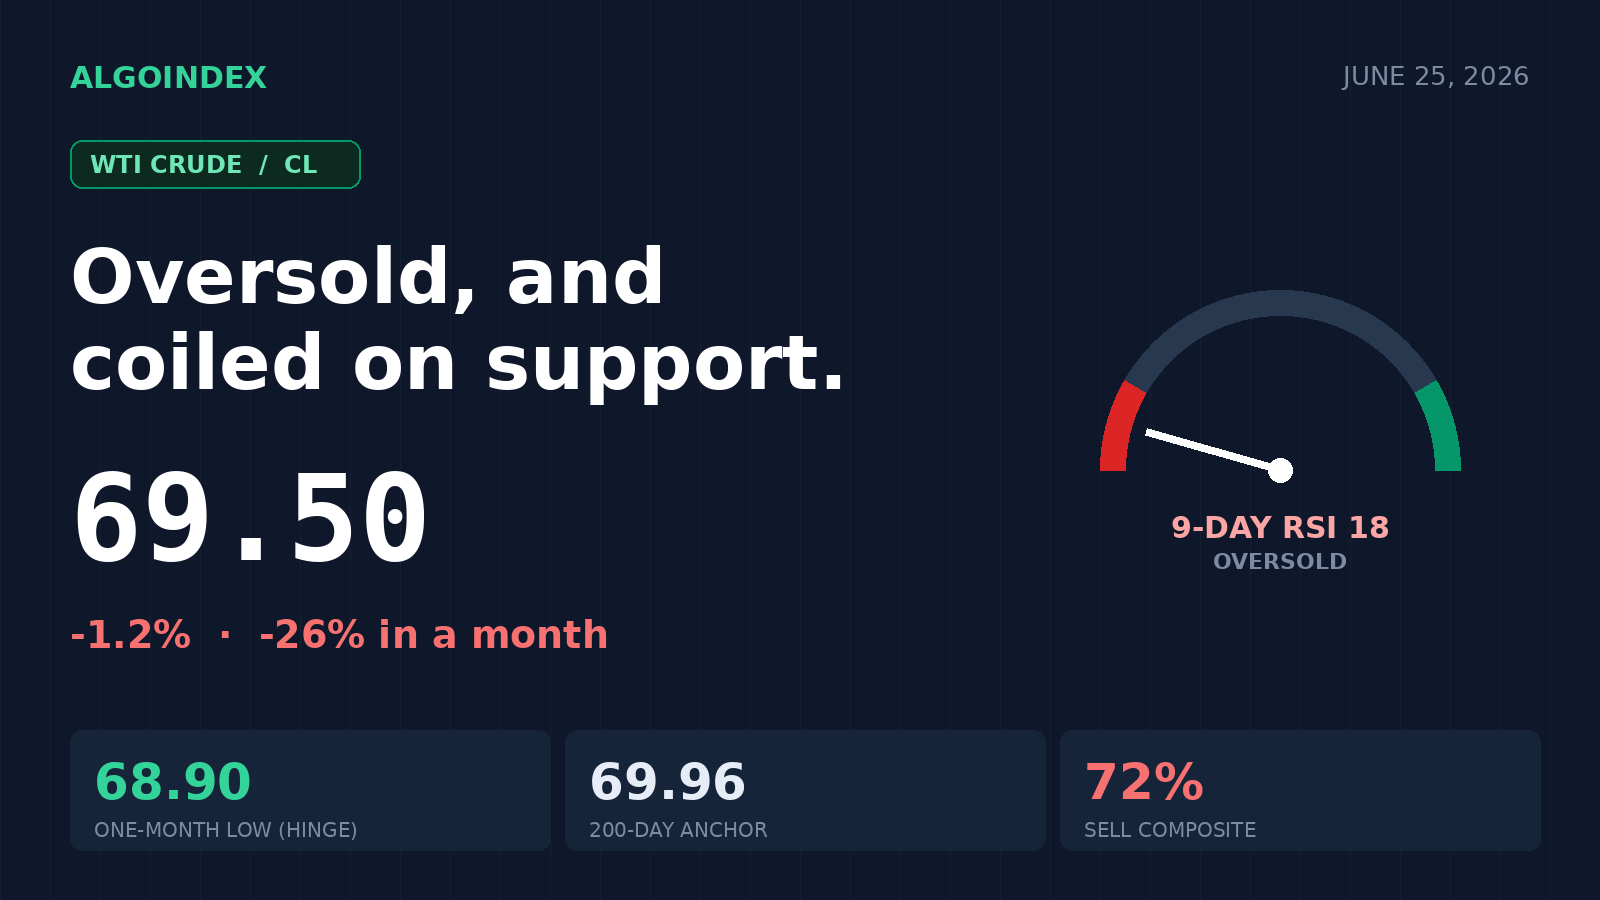
A month ago crude carried a war premium and traders watched the Strait of Hormuz for the next shock. This morning West Texas Intermediate is testing 68.90, a one-month low, after shedding roughly 26 percent in a month, and the only question left is not whether the trend is down but how much energy is left in a market this oversold.
WTI trades near 69.50 in pre-market dealing, down about 0.84, or 1.2 percent, against the prior settle of 70.34. The overnight session was a study in exhaustion rather than fresh selling: crude opened the Globex window at 69.95, probed down to 68.90, the one-month and thirteen-week low, then recovered into the upper half of a contained 68.90 to 70.21 band. With the 14-day average true range running near 4.22, that overnight range of just 1.31 is a fraction of a normal day's travel. The compression after a steep decline is the central tension: the trend is unambiguously lower, yet the short-term oscillators are now at a degree of oversold that historically precedes at least a reflexive bounce.
The macro overlay adds a second layer of tension. The 8:30 ET data slate is dense, headlined by the May PCE inflation report alongside final first-quarter GDP, durable goods, and weekly jobless claims, with the headline year-over-year PCE forecast near 4.1 percent against a 3.8 percent prior. A firm print would lift the dollar and pressure crude back toward 68.90; a soft print could relieve that pressure and aid the oversold-bounce thesis. There is no weekly petroleum inventory report today, so the transmission to crude is indirect, working through the dollar and the broad risk tone.
A compressed spring at oversold extremes
The oscillator readings are at genuine extremes. The 9-day relative strength sits near 18 and the 14-day near 26, both deep in oversold territory, while raw stochastics are near 4 percent and 3 percent, about as washed-out as these measures get. The directional system confirms a strong, mature downtrend: the 9-day directional index near 37 with negative directional pressure near 36 dwarfing positive pressure near 11. The multi-indicator composite reads 72 percent sell. That combination, a powerful one-sided move that has reached a momentum exhaustion point, argues for sharp two-way volatility rather than a clean continuation lower.
The moving-average stack is bearishly aligned, with spot below its near-term and intermediate averages, the short 5-period average sitting well above price after the rapid fall. The one notable exception is the long-term 200-period anchor near 69.96, which spot is now testing from below. A daily close back above that average would be the first technical signal the downside momentum is stalling; continued trade beneath it keeps the bearish structure intact. The 14-day average true range near 4.22 (about 6.1 percent of price) and historic volatility near 33 percent frame a wide one-ATR envelope of roughly 66.8 to 75.3 around the 71.05 pivot.
68.90 is the hinge
The immediate support base is the overnight and one-month low at 68.90, reinforced by the thirteen-week low at the same price and a computed target at 69.05 just above it. A decisive break and acceptance beneath 68.90 opens the one-standard-deviation support at 67.75 and the second pivot support at 67.50, with deeper extensions at 66.68, 65.86, and 65.37. Overhead, the overnight high at 70.21 capped the recovery, the prior settlement at 70.34 is the line bulls must reclaim, and the session pivot at 71.05 aligns with the relative-strength-30 marker at 71.45, ahead of the 72.47 first pivot resistance, which coincides with a 38.2 percent retracement.
The conditional path respects the washout: a counter-trend long only on confirmation, entering 68.95 to 69.10 on a clear rejection of the 68.90 base with a reclaim of the round number after 9:45 ET, stop 68.40, targeting 70.00 then the 70.34 to 71.05 zone. The supply story has turned bearish, with reports that Iraq is weighing an exit from the producer group to pump more freely, while geopolitics, once the bullish engine, has flipped: the Israel and Hezbollah ceasefire and conciliatory signaling toward Iran have drained the war premium. Positioning is bearish but stretched, the kind of one-sided book that produces violent short-covering on any positive surprise. The base case is a morning test of 68.90 and a stabilization attempt, chopping in a 68.90 to 70.50 band as the market digests the inflation data.
The complete data picture
For readers who want the full structure rather than the summary, here is the entire computed level map and the complete set of momentum, volatility, and positioning readings behind today's view.
| EXPECTED RANGE TODAY | |
| Low | through 68.90 toward 67.75 to 67.50 |
| Most-likely mid | 68.90 to 70.50 chop |
| High | through 70.34 toward the 72.47 pivot resistance |
Path A continuation lower 40%, Path B oversold stabilization 45%, Path C short-covering squeeze 15%.
Full session calendar. 06:00 UK CBI Distributive Trades (actual -54 vs -40 forecast); 08:30 US PCE Price Index YoY forecast 4.1% vs 3.8% prior, plus core PCE, final Q1 GDP, durable goods, personal income and spending, and initial jobless claims; 10:00 University of Michigan final sentiment and inflation expectations; 11:30 Fed's Kashkari; 15:40 Fed's Williams; 18:30 Fed's Goolsbee. No weekly petroleum inventory report today.
AlgoIndex publishes computed structure every session and tracks how the calls perform on the performance statement. Compare strategies on the pricing page, learn the method in the trading signals guide, and log every fill with the free AI Trading Journal.



