
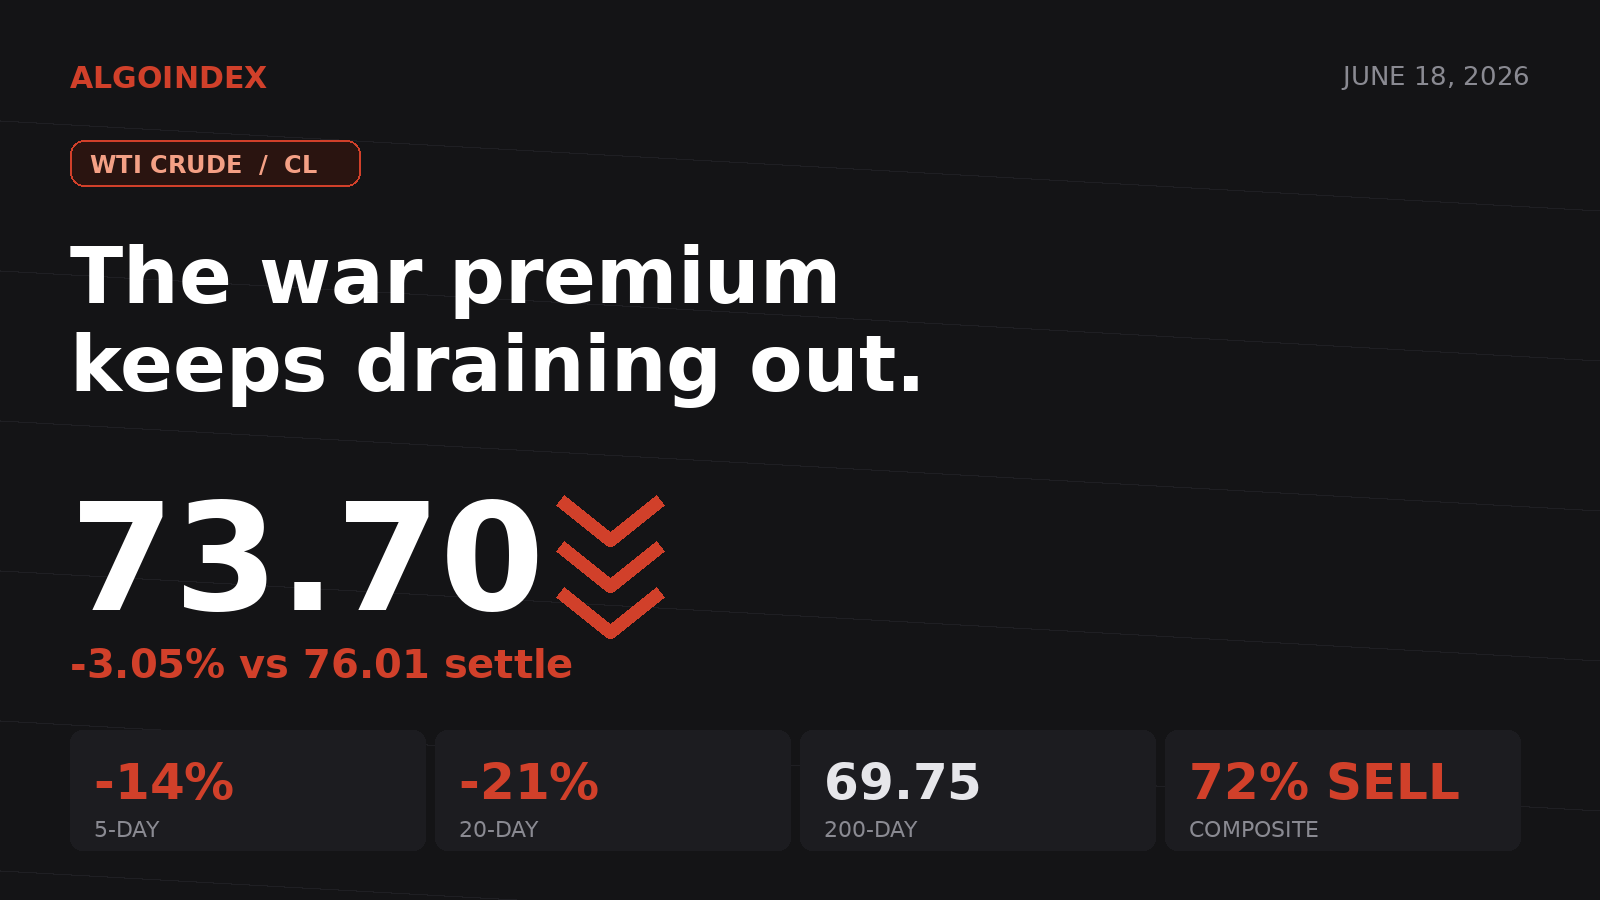
Three weeks ago crude was reaching toward triple digits on fear of a regional war. This morning, front-month West Texas Intermediate is bleeding toward its 200-day average near 69.75, and the same supply-shock premium that inflated the move is now draining out of the curve faster than it was priced in.
WTI opened the overnight session near 74.88 and slid to roughly 73.70, down about 2.32 points or 3.05% against the prior settle of 76.01, carving an overnight band of 73.42 to 75.75. This is not an isolated down day. Over the trailing five sessions the contract has shed about 14%, and over twenty sessions about 21%. The single largest force in the market is the reversal of war-premium pricing, and the contract is closing the early window pinned in the lower quarter of its range with no meaningful reclaim of the 75 handle.
The structural contradiction into today is the gap between the headline narrative and the price. The energy news flow still carries supply-anxiety framing, including warnings that regional shipping disruption may take a long time to normalize, yet the contract is collapsing toward long-term support. Momentum and trend studies are uniformly bearish, the multi-indicator composite reads 72% on the sell side, and short-term oscillators are deeply oversold. That combination, a strong downtrend pressing into long-term support with stretched oscillators, defines the day: sellers own the trend, but the easy part of the move is behind us, and price is entering a zone where mean-reversion risk rises.
A descent that has run far below the averages
The moving-average stack is unambiguously bearish in the near term and supportive only at the long end. Against a spot near 73.70, the 5-day sits at 77.65, the 20-day at 86.17, the 50-day at 87.68, the 100-day at 80.12, and the 200-day at 69.75. Price is beneath the 5, 20, 50, and 100-day averages and above only the 200-day. The elevated 20-day and 50-day relative to the 100-day capture the prior spike toward 100 and its subsequent collapse: the intermediate averages are still catching down to price. The one meaningful support reference in the entire stack is the 200-day at 69.75, which frames the major line in the sand for the broader trend.
Short-term momentum is deeply oversold. The 9-day relative strength reads 24.20 and the 14-day 31.22, with the 20-day at 36.62 and the 50-day near the midline at 46.57. Raw stochastic readings are pinned near the basement, the 9-day at 3.88% and the 14-day at 3.75%, the kind of compression that frequently precedes at least a relief bounce. Trend strength confirms the downside, with the 9-day directional index at 29.85 and the negative directional line at 33.33 dominating the positive at 9.36. Volatility is high: the 14-day average true range is 4.64, about 6.25% of price, and 14-day historic volatility sits at 45.92%, so a 14:00 macro catalyst could easily extend the day toward a full four-point range.
The shelf at 73.42 decides the day
Immediate support is the convergence at 73.67 to 73.42, where the first pivot support, the computed target price near 73.64, and the one-month and thirteen-week lows at 73.42 all stack together. This is the decisive shelf, and a sustained break beneath 73.42 is the bearish trigger. Below it, 72.84 marks the 14-day oversold reference and 72.47 the 38.2% retracement, with first standard-deviation support at 72.26. The next defended zone is the 71.34 second pivot support and the 70.71 two-standard-deviation band. The major downside objective is the 69.52 to 69.75 area, where the third standard-deviation support meets the 200-day average.
Overhead, the first reference is the 75.75 overnight high, the level whose failure capped the session. Just above it sits a dense supply band from the 76.01 prior settle to the 76.43 standard pivot, the single most important ceiling on the chart and the line that separates selling the rally from a trend in doubt. Above that, 76.88 marks a momentum-stall reference and 77.74 the halfway retracement of the 52-week range.
The conditional path is the breakdown. If price breaks and accepts beneath 73.42 after 09:45 ET on expanding range, the momentum continuation is to sell the retest of 73.40 to 73.67 with a stop above 74.30, targeting 72.30, then 71.34, then 70.71. Either way the invalidation is the same: a sustained reclaim and acceptance above 76.43 negates the bearish read.
A heavy macro day stacked toward 14:00
Today is a central-bank-heavy session that will drive the dollar and, through it, crude. The European morning brings a Swiss decision held at 0.00%, a Norwegian rate held at 4.25%, a Russian decision near 14%, and a UK Bank Rate held at 3.75% with the vote split, alongside UK unemployment at 4.9% and average weekly earnings at 4.4% year over year. At 08:30 ET the US releases the Philadelphia regional business survey, with a prior reading of -0.4 against a consensus near 10. The energy-specific catalyst is the monthly international energy demand report. The dominant set-piece is the 14:00 ET policy rate statement and projections, the single highest-impact scheduled event for the dollar and therefore the first-order risk for crude into the close.
The cross-asset picture frames the move as energy-specific rather than a broad growth scare: equity-index futures are firm and the broad market is higher, a risk-on tone that contrasts with crude's slide. There are also slower structural signals on the demand side, including evidence that elevated fuel prices earlier in the cycle accelerated electric-vehicle adoption in Europe, a bearish long-run input even if its near-term price impact is small. Sentiment is decisively bearish and arguably crowded: the composite has held a 72% sell posture for the past week, against a one-month composite of only 8% sell, capturing how quickly consensus flipped. That rapid swing, combined with deeply oversold short-term oscillators, is the setup for a counter-trend squeeze if a catalyst appears, and the absence of one keeps the path lower.
Stand aside through the 14:00 ET release window, avoid initiating fresh shorts directly into the 69.5 to 69.8 support without a confirmed breakdown, and the base case holds: a morning test of 73.42, an oversold consolidation beneath the 76.43 ceiling, and a sharp afternoon repricing that resolves the day.
AlgoIndex publishes computed structure and dealer-positioning context every session, and our performance statement tracks how the levels behave over time. See the full strategy lineup on the pricing page, and log every fill against the plan with the free AI Trading Journal.
Latest session: Crude Oil Bleeds to a 3-Month Low as the War Premium Unwinds →



