
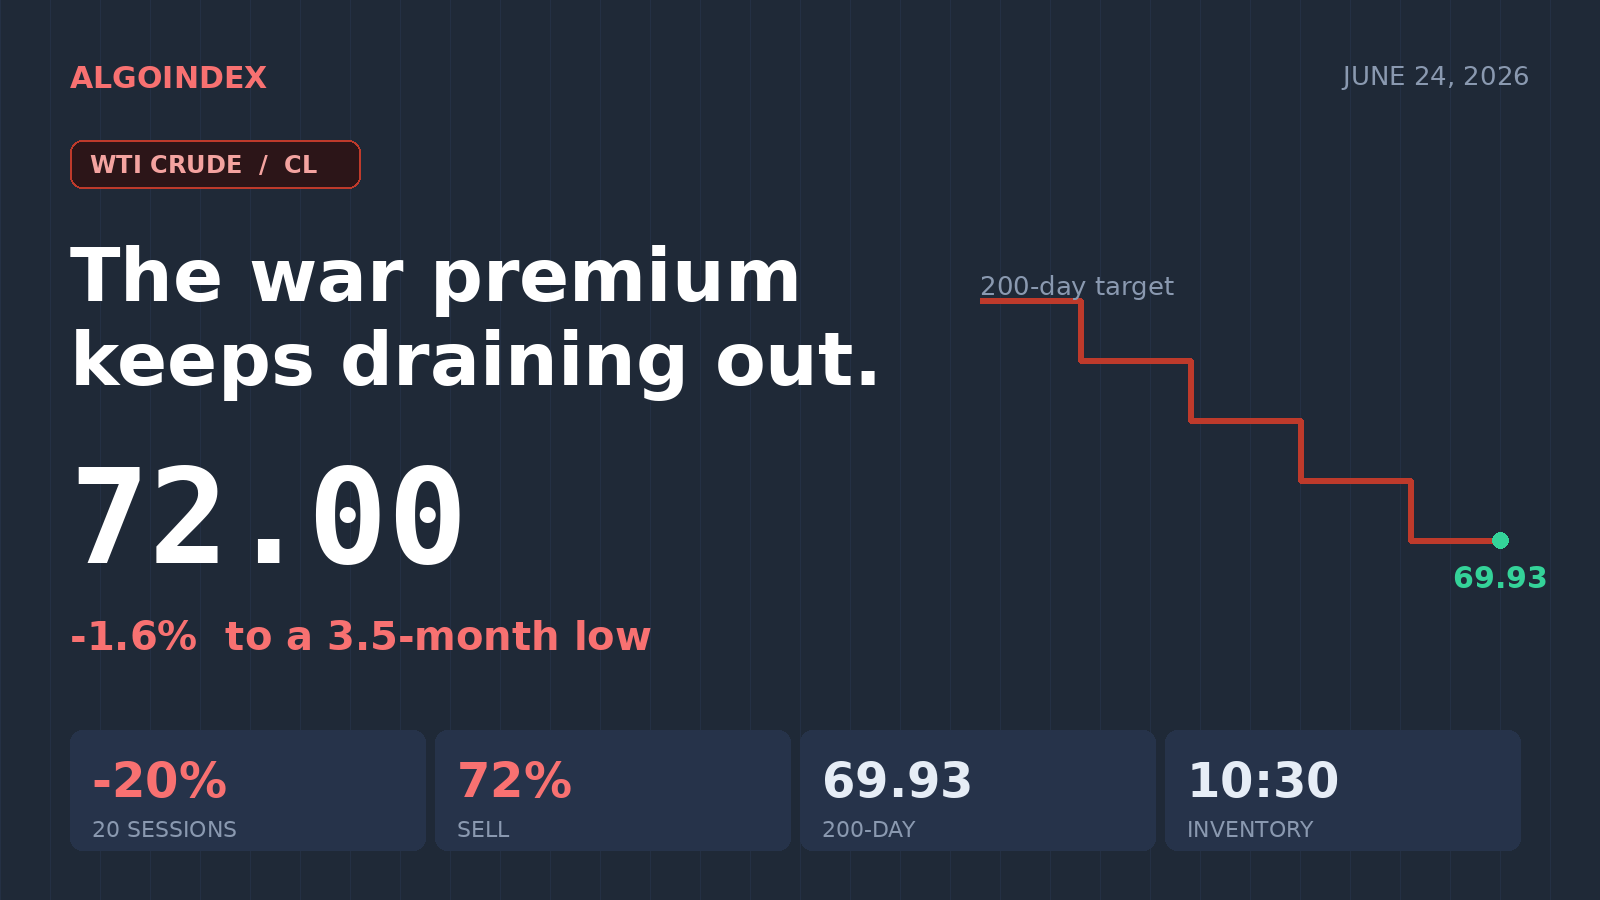
Three weeks ago, traders were pricing crude toward triple digits on fear that the Strait of Hormuz might close. This morning the same chokepoint is being de-mined and reopened, and West Texas Intermediate is bleeding toward a three-and-a-half-month low, last near 72.00, with the war premium that built the spring rally draining out by the day.
Front-month WTI trades down roughly 1.6% against Tuesday's 73.21 settle, after an overnight band of 71.55 to 73.18. The contract is off about 4.5% over five sessions and roughly 20% over twenty, and it now sits below every major moving average except the 200-day. Two forces are driving the slide: a collapsing geopolitical premium and a dollar at a thirteen-month high. The overnight news flow carried a declaration that the United States and Iran framework is complete, that scheduled strikes were cancelled, and that a separate Israel and Hezbollah ceasefire is set for Friday.
The contradiction into today is between trend and exhaustion. The directional studies are firmly bearish, the multi-indicator composite reads 72% sell, and the negative directional line dominates the positive. Yet short-term momentum is deeply oversold, with nine-day relative strength near 21, fourteen-day near 29, and raw stochastics pinned at 2 to 3%. Price is pressing directly into the 71.55 multi-week shelf with the 200-day average just beneath at 69.93. This is a sell-the-rally environment, not a chase-the-breakdown one.
A descent that has run far below the averages
Against spot near 72.00 the average stack is decisively bearish and steeply inverted. The 5-day sits at 74.20, the 20-day at 83.39, the 50-day at 87.17, the 100-day at 80.47, and the year-to-date at 77.07. Price trades below all of them. The only average beneath spot is the 200-day at 69.93, which now stands as the major longer-term support and the extended downside objective. The wide gap between spot and the 20- and 50-day averages quantifies how far and fast this contract has fallen, the kind of stretch that eventually invites mean-reversion bounces, though none has held yet.
The first overhead reference is the computed pivot at 73.38, coinciding almost exactly with Tuesday's 73.21 settle and the 73.18 overnight high, forming a dense 73.2 to 73.4 supply shelf that is the decisive sell-rally line. Above it, the first computed resistance is 74.28 with a one-standard-deviation band at 74.92, then the second resistance at 75.35 and the extended ceiling near 76.2. Immediate support layers tightly beneath spot: the 38.2% retracement at 72.47, the first support at 72.31, and a computed target near 72.19, then the critical 71.55 base where the overnight low, one-month low, and thirteen-week low all stack together.
The premium unwind, in three headlines
The supply picture has flipped from feared-disruption to easing in a matter of days. The Strait of Hormuz is being reopened and de-mined, with regional reconciliation talks between Iran, the Gulf states, and Iraq underway in Riyadh, where Gulf states are pushing for no transit fees and Iran is expected to propose only modest navigation charges, a far cry from the closure scenario that built the spring premium. Qatar signaled its liquefied natural gas exports could return to normal within weeks. On the demand side, a sharp risk-off equity session the prior day, with the broad index down about 1.5% on a technology-led decline, dented confidence in forward energy demand, and reports of India trimming coal imports add a marginal-demand wrinkle.
A firmer dollar is the second engine of the decline, sitting near a thirteen-month high after a hawkish lean across the rate complex, with nine of eighteen policy participants now penciling a 2026 rate increase. Today's data slate, headlined by final first-quarter growth, durable goods, and weekly claims at 08:30 ET, will shape the dollar's next move and, by extension, crude's.
The 10:30 inventory print is the swing event
The morning is dominated by the weekly inventory release at 10:30 ET, with the headline crude figure forecast at roughly a negative 3.6 million barrel draw against a prior draw near 8.3 million. A larger-than-expected draw would be a bullish surprise and the most likely trigger for a counter-trend bounce off support; a build or a smaller draw would reinforce the downtrend and pressure the 71.55 shelf. Given the de-escalation backdrop, the market may fade a bullish number, so the reaction quality matters more than the headline. Monthly supply-and-demand reports from the major energy agencies land through the day, and a roster of policy-maker appearances poses dollar-driven risk into the afternoon.
The conditional path is the breakdown: if price breaks and accepts beneath 71.55 after 09:45 ET on expanding range, sell the retest of 71.55 to 71.90 with a stop above 72.55, targeting 70.79, then 70.34, then the 69.93 area, taking partials aggressively into the 200-day rather than expecting a clean break on the first touch. Stand aside in the minutes bracketing the 10:30 print, and avoid initiating fresh shorts directly into the 69.9 to 70.3 zone without a confirmed breakdown, since that area is a high-probability mean-reversion magnet given how oversold momentum already is. The base case is continued heaviness with a probe of 71.55, an inventory-driven reaction that decides the afternoon, and a sell-the-rally character on any bounce.
The complete data picture
For readers who want the full structure rather than the summary, here is the entire computed level map and the complete set of momentum, volatility, and positioning readings behind today's view.
| EXPECTED RANGE TODAY | |
| Low | 70.79, then 70.34, with 69.93 the extended objective |
| Most-likely mid | 71.4 to 73.4 grind |
| High | through 73.4 toward 74.28 to 74.92 |
One-ATR envelope around the 73.38 pivot is roughly 69.4 to 77.4; practical working range 70.0 to 73.4.
Full session calendar. 08:30 final Q1 GDP, price index, durable goods and core, initial and continued claims; 10:00 policy committee testimony; 10:30 weekly EIA crude inventories (forecast about -3.6M, prior about -8.263M); 11:30 policy-maker remarks; through the day the monthly OPEC and IEA oil reports and a tentative short-term energy outlook; 15:40 and 18:30 additional remarks.
AlgoIndex publishes computed structure every session and tracks how the calls perform on the performance statement. Compare strategies on the pricing page, learn the framework in our trading signals guide, and log every fill with the free AI Trading Journal.
Latest session: Crude Oil Is Oversold and Compressed on Support →



