
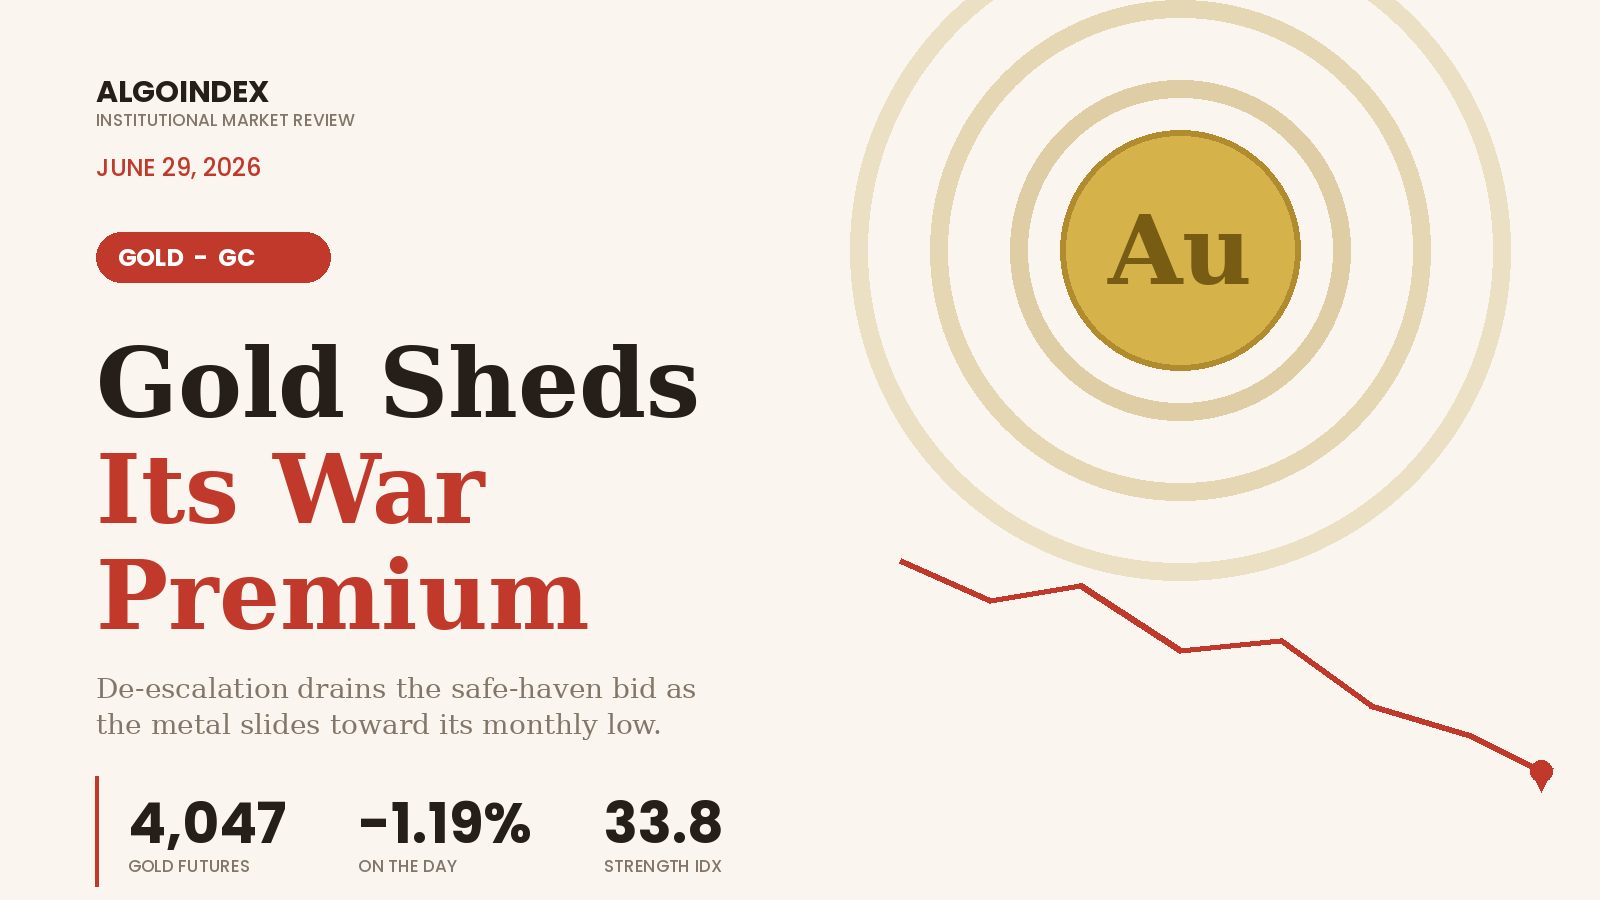
From 4,103 down to 4,038, gold spent the overnight session in a single, sellers-only slide. The August contract opened near 4,101, tagged a high of 4,102.9, then bled lower through the early-morning hours with no meaningful bid stepping in to defend the round-number 4,050 area, trading near 4,047 as the cash session approaches. The absence of any sustained counter-bounce is the tell. This was motivated, one-sided supply, not a routine pullback.
It is also not an isolated down day. Gold has shed 152.9 points, or 3.64%, over the past five sessions, and now sits roughly 29% below its 52-week high of 5,706 while holding about 18% above the 52-week low of 3,441.5. The dominant driver is a steady unwind of the safe-haven premium that had been embedded in the metal. Geopolitical headlines have shifted from escalation to de-escalation, with reports of Iranian assets being released from Qatar, tentative contact between Tehran and Washington, and a standing Israel-Hezbollah ceasefire. As war-risk hedges come off, the marginal buyer of gold steps back. Layered on top is a more hawkish lean in policy commentary, with one Federal Reserve official openly favoring a rate increase this year, a stance that lifts real-rate expectations and weighs on a non-yielding asset just as risk appetite rotates into equities and the technology complex.
The structural contradiction heading into today is the tension between an exhausted, oversold momentum profile and a still-intact downtrend. The 14-day strength reading near 33.8 and washed-out short-term oscillators argue that a relief bounce is increasingly probable, yet price remains below every major moving average, the multi-indicator composite reads a unanimous sell, and trend strength is high. The base case favors selling rallies into overhead supply rather than chasing the downside at the lows, while respecting that a clean break of the 4,038 to 4,025 support shelf opens a quick path toward the 3,975 monthly-low area.
A fully bearish alignment, stretched to the downside
On the daily chart gold is in a clearly defined down-leg, pressed against the lower end of its recent range and well below the 20-day average of 4,269 and the 50-day of 4,510. The four-hour structure shows a sequence of lower highs and lower lows, the signature of a controlled downtrend; the recent swing high near 4,103 was rejected cleanly, and each intraday bounce has been sold. With the fast 5-day average near 4,070 now turning down and price beneath all of them, the moving-average picture offers no support overhead. The 5-day instead acts as dynamic resistance.
Momentum is oversold but not yet capitulating. The 14-day strength index reads 33.82 and the 9-day 32.85, both approaching the 30 threshold, while short-term stochastics sit deeper into oversold near 20.9 and 18.8. The directional system confirms a strong, mature downtrend: trend strength sits at 40.23 with the negative directional line at 30.27 dominating the positive line at 11.06. The multi-indicator composite registers a unanimous 100% sell, rated strong and strengthening. Volatility is elevated, with the 14-day average true range at 120 points, or 3.00%, which frames an unusually wide one-range envelope of roughly 3,927 to 4,167 and argues for patience on entries.
The levels that matter
The pivotal intraday ceiling is the 4,066 to 4,069 band, where the daily pivot, a target-price reference, and the falling 5-day average overlap. The options-derived dealer positioning on the gold ETF proxy places a call-gamma reference that maps to roughly 4,065 in futures terms, reinforcing this band as the first meaningful resistance. Above it sit the prior settle at 4,096, the session high at 4,103, and the first computed pivot resistance at 4,139.
Net dealer gamma on the proxy reads negative on both the call and put sides, totaling roughly negative 376 million notional. Negative positioning means hedgers trade in the direction of price moves rather than against them, which amplifies directional momentum and supports continued trend extension rather than mean-reverting pinning. That is consistent with the clean, one-sided overnight selloff, and it argues that breakdowns are more likely to accelerate than be absorbed until price reaches the 3,920 to 3,975 demand area.
Crowded longs, an unwinding bid
The most important swing factors for gold are not on the calendar at all. They are the trajectory of policy commentary on the rate path and any shift in the de-escalation narrative. Friday's inflation print was actually a touch softer than expected, with the core monthly gauge at 0.4% against a 0.5% forecast, a mildly dovish surprise that in isolation should help gold. Yet hawkish rhetoric has overwhelmed the soft data and kept the policy-path narrative firm, while a consumer sentiment gauge was revised to a soft 49.5.
Positioning is the double-edged read. As of June 23, managed money was long 131,102 against short 15,707, and the broader non-commercial category long 217,028 against short 35,689. Speculators remain heavily net long even after the decline, which reflects residual conviction but also leaves substantial long inventory exposed to further liquidation if the slide extends.
With a quiet data calendar today, the afternoon is likely governed by month-end and quarter-end positioning flows, since this is the final session of the first half, and rebalancing can produce sharp, news-light moves. The week's first-order events arrive later, with private payrolls and the manufacturing activity index due Wednesday, July 1, and a broader labor-market report ahead of the holiday weekend. The highest-probability morning script is a corrective bounce into the 4,066 to 4,096 band that is then sold; the alternative is an immediate break of 4,038 to 4,025 that extends toward 3,985 and 3,975.
The metal is oversold, but oversold in a strong downtrend with hedgers leaning the same way is a reason to sell strength, not to buy weakness. The bid that built this rally is the one now walking out the door.
The other side of the de-escalation trade: crude bounces off a four-month low. Where gold stood last week: pinned on support as the dollar hit a 13-month high.
See how AlgoIndex turns this kind of read into systematic, rules-based signals.
View pricing →


