
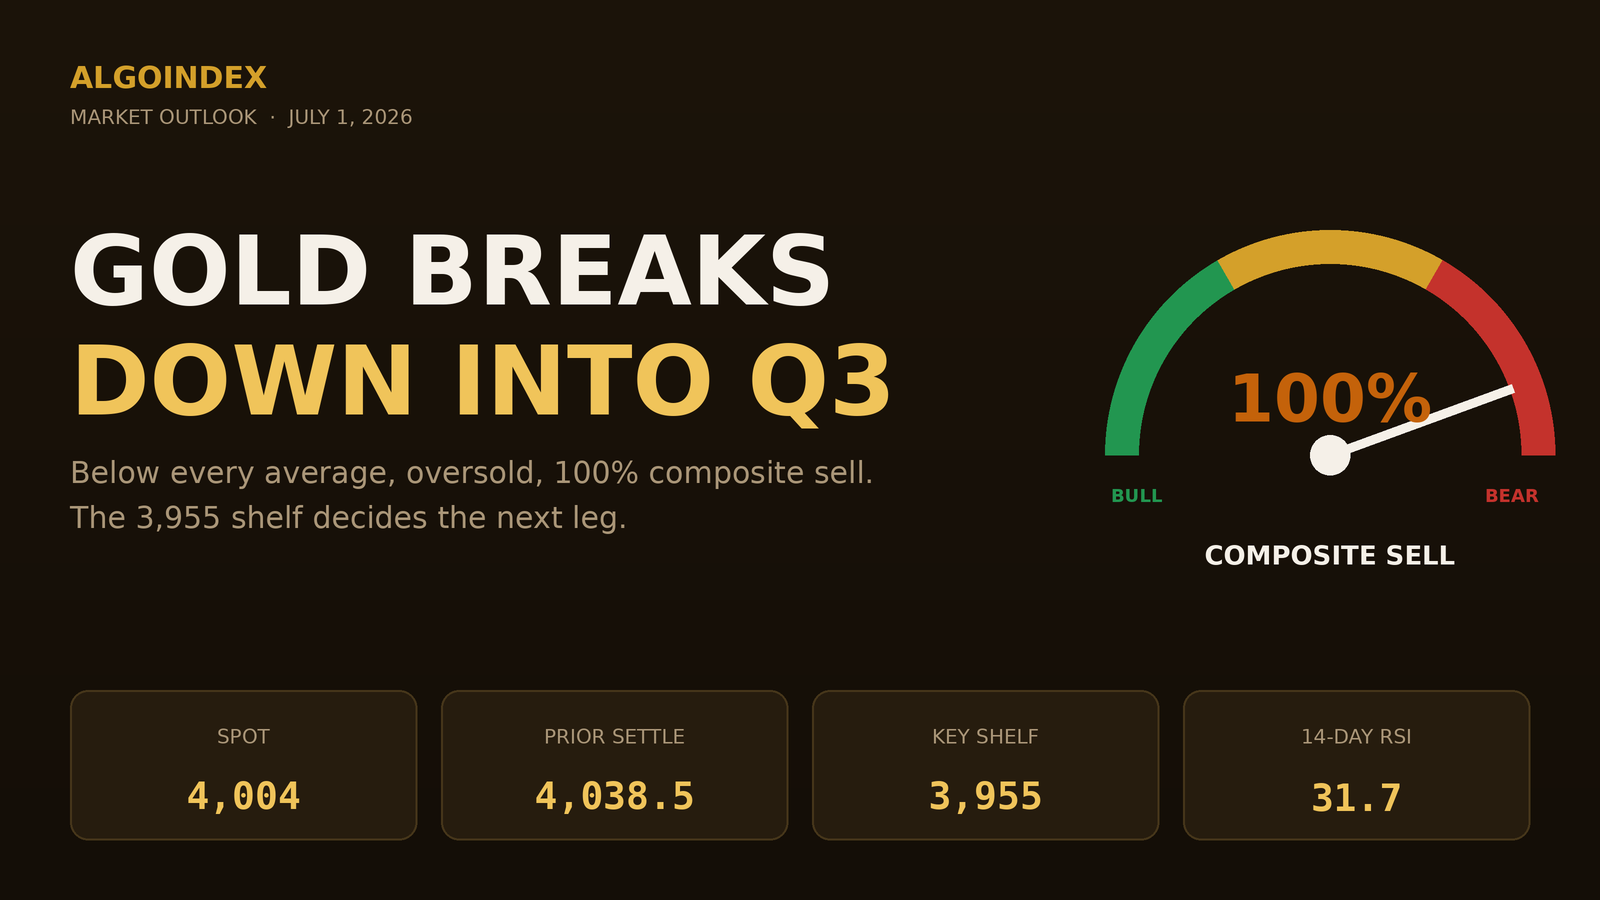
The parabola that defined gold through the first half of the year has snapped into a steep, orderly liquidation, and on the first morning of the third quarter the metal is trading in an outright breakdown. The front-month contract settled the prior session at 4,038.5, then the overnight session carved a low of 3,973.0 before stabilizing back toward the 4,000 round number, leaving spot near 4,004, a decline of roughly 34 points, or 0.83 percent. This is not a wobble inside an uptrend. Price sits below every meaningful moving average, momentum oscillators are pinned in oversold territory, and the multi-indicator composite reads a full 100 percent sell.
The scale of the repricing deserves emphasis. The 200-day average sits at 4,547 and the year-to-date average at 4,750, yet spot is now near 4,004, roughly 12 percent below the 20-day average and close to 20 percent under the 100-day. The contradiction carrying into today is the familiar tension between a powerful downtrend and a deeply oversold condition: the 9-day and 14-day relative-strength readings sit near 30 to 32, stochastics are compressed in the low teens, and price is pressing the 4,000 handle just above the 3,955 monthly low. Oversold does not mean reversal, but it does raise the odds of sharp, fast counter-trend bounces that fade into overhead supply.
Why gold is heavy this morning
The macro backdrop is uniformly gold-negative. The Dollar Index is firm near 101.35, up about 0.17 percent, and Treasury yields are rising, with the ten-year up roughly 0.75 percent on the day toward 4.46 percent. A stronger dollar and firmer real yields raise the opportunity cost of holding a non-yielding asset and are the most direct headwind on the metal. Cooler European inflation compounds the pressure: the euro-area headline flash printed 2.8 percent year over year against a 3.0 percent forecast, and the core flash 2.4 percent versus 2.5 percent expected, both softer than anticipated. Cooler inflation trims the inflation-hedge case at the margin and supports the view that developed-market central banks retain room to ease on their own schedule rather than being forced.
The safe-haven premium is draining as immediate geopolitical stress eases, and the broader metals complex confirms this is a sector move rather than a gold-specific quirk. Silver is down roughly 2.4 percent to the 58.5 area, falling harder in percentage terms, a sign of risk being taken out of the higher-beta precious metals. Official-sector accumulation remains a structural pillar under the medium-term picture, but that demand is price-insensitive and slow-moving, and near-term it is being overwhelmed by momentum selling and a firmer dollar. Equity volatility is subdued near 16.7, indicating the liquidation is orderly rather than a broad risk panic.
The structure, level by level
The first overhead friction is the 4,018 to 4,024 zone, combining a stochastic stall with the standard pivot at 4,024. Above sits the overnight high at 4,032, then the 4,037 target and 4,038 prior close, a tightly packed supply shelf that any bounce must clear to change the near-term tone. Higher still lie the deviation bands at 4,073, 4,088 and 4,099, the first pivot resistance at 4,093, and the 9-day cross near 4,104, with the second pivot resistance at 4,147 and third at 4,215 marking the deeper recovery targets. Underneath, immediate support begins right at the 4,004 deviation band where price is trading, followed by 3,989 and 3,978, then the overnight low at 3,973 aligned with the first pivot support at 3,970.
The pivotal shelf is 3,955, where the one-month low and 13-week low coincide with the 14-day relative-strength 30 percent reference at 3,954, making it the single most important support base of the session. A decisive loss opens the second pivot support at 3,901 and the third at 3,847, with the deeper structural references at 3,531 and the 52-week low at 3,441. The average true range is elevated at roughly 115 to 120 points, or about 3 percent, so a one-range band around the 4,004 print frames a wide session envelope of roughly 3,895 to 4,115, though the more probable travel sits between the 3,955 breakdown pivot and the 4,038 prior close given the oversold compression.
The complete data picture
Level map (GC futures)
| Zone | Level (GC) | What it is |
|---|---|---|
| Resistance | 4,215 / 4,147 | 3rd / 2nd pivot resistance (deep recovery) |
| Resistance | 4,104 / 4,093 / 4,099 | 9-day cross, pivot R1, 3rd deviation band |
| Resistance | 4,073 / 4,088 | 1st / 2nd standard-deviation band |
| Resistance | 4,037 to 4,038 | Target / prior close (supply shelf) |
| Resistance | 4,032 / 4,024 | Overnight high / standard pivot |
| At market | 4,004 | 1st deviation band, compressing the 4,000 handle |
| Support | 3,989 / 3,978 | 2nd / 3rd deviation band |
| Support | 3,973 / 3,970 | Overnight low / 1st pivot support |
| Support | 3,955 | 1-month + 13-week low, RSI 30% (key base) |
| Support | 3,901 / 3,847 | 2nd / 3rd pivot support (breakdown targets) |
| Support | 3,531 / 3,441 | RSI 20% / 52-week low (structural) |
By the numbers
4-hour candle: 3,997.8 / 4,007.6 / 3,994.6 / 4,002 (o/h/l/c). Moving averages: 5-day 4,044, 20-day 4,219, 50-day 4,475, 100-day 4,724, 200-day 4,547, year-to-date 4,750. Stochastics 9-day %K 14.8 / %D 18.4, 14-day %K 14.3. Directional index 9-day 49.3 (negative line 29.5 vs positive 8.7), 14-day 41.7. Historic volatility 22% to 29%. Weighted alpha +2.46, short-term strength score 31. Cross-asset: Dollar Index 101.35 (+0.17%), 10-year about 4.46%, silver near 58.5 (-2.4%), equity vol 16.7, S&P near 7,535, Nasdaq near 30,386.
Gold-ETF proxy read (directional context, not a futures gamma map): proxy near 367.7 vs prior 368.6, primary gamma concentration near 360, secondary near 288, put-side gamma about -311 million versus call-side about -99 million, one-month realized volatility near 30%.
The three paths (desk probabilities)
Path A, sell the rally and continue lower (about 50%): price bounces into 4,024 to 4,038, fails, and works down to 3,970 then 3,955, with a breakdown extending toward 3,901.
Path B, oversold bounce (about 30%): 3,955 to 3,970 holds, the oversold reading triggers a reclaim of 4,024, and price squeezes toward 4,038 to 4,073 before sellers re-emerge.
Path C, sideways compression (about 20%): gold ranges between 3,973 and 4,032 all session as the market waits for the next macro catalyst.
Expected range today: low reference 3,955 extending to 3,901 on a breakdown, most-likely mid 4,004, high reference 4,038 extending to 4,073 on an oversold squeeze; the wider one-range envelope spans 3,895 to 4,115.
Today's calendar (ET)
- 05:00 · Euro-area flash inflation, released softer (headline 2.8% vs 3.0%, core 2.4% vs 2.5%)
- Morning · European manufacturing surveys, mixed to soft; UK house prices steady at 2.2%
- 10:00 · US manufacturing purchasing-managers survey and job-openings report (most likely intraday catalysts, via the dollar and yields)
- Through the session · Central-bank policy forum commentary on the rate path
The setup reflects the trend. The higher-conviction posture is to sell strength into the 4,024 to 4,038 supply shelf on a rejection after 9:45 ET, targeting the 3,989 to 3,978 band, then the 3,955 to 3,970 base, with 3,901 the extended objective on a decisive breakdown and a stop above 4,050 where a clean acceptance over the shelf and the 5-day average near 4,044 invalidates the continuation thesis. The mirror is a lower-conviction counter-trend scalp: a defended hold of 3,955 to 3,970 with a reclaim above 3,990 can spring a bounce toward 4,024 then 4,038, to be managed tightly and exited into the shelf where trend sellers re-engage.
A firm dollar or a fresh yield spike accelerates the downside and favors pressing the deeper targets; a sharp dollar reversal or a renewed safe-haven headline is the most obvious catalyst to hand the counter-trend bounce control. Until one of those appears, the session belongs to sellers who fade strength, and the 3,955 shelf is the line that decides whether today is another leg down or the start of a base. Gold trades its own liquidation this morning, and the oversold reading is a warning to size the shorts, not a reason to buy the metal.
Trade the levels, not the noise.
AlgoIndex marks the dealer-positioning levels before each session and scores whether they hold. See the running numbers in the gamma level accuracy tracker, then view pricing.
Foundational guides: gamma exposure explained, call walls and put walls, and market internals.



