
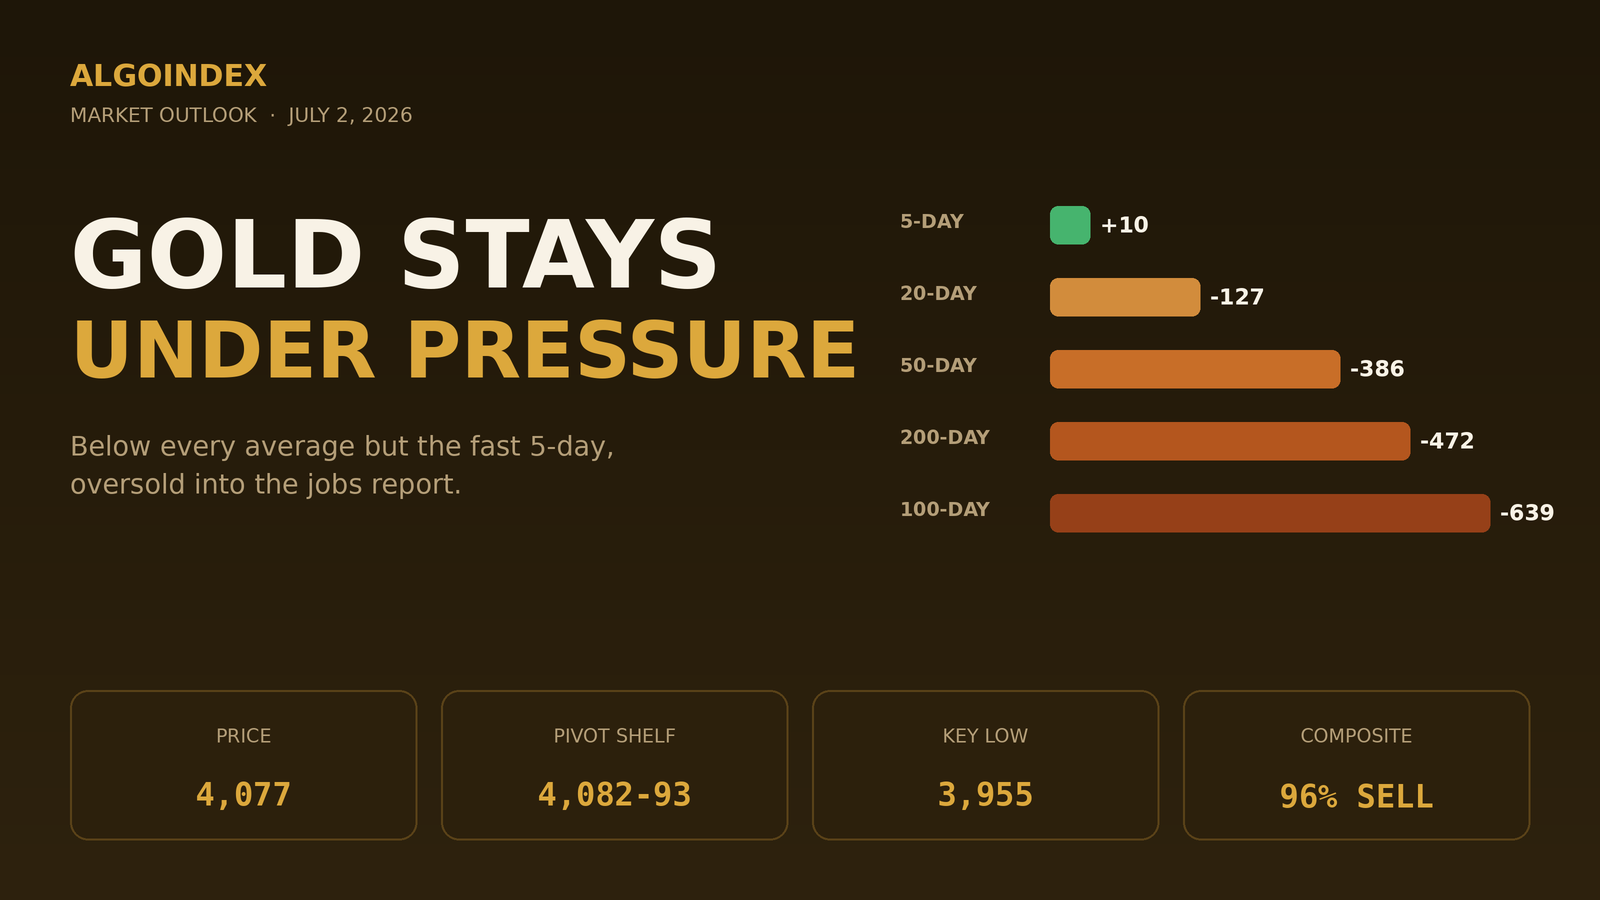
Gold enters Thursday trading near 4,077 on the August contract, down about 5 dollars from the prior settlement of 4,082.4. On the surface the overnight session was quiet, an inside-to-balanced affair from 4,042.8 to 4,092.6 with price compressing in the upper half around 4,080. Underneath, the structure is anything but. The metal is caught between two opposing forces: on the intermediate and primary timeframes it is in a well-defined corrective decline, below every average from the 20-day out to the 200-day, with a trend-strength reading firmly bearish and a multi-indicator composite at 96 percent sell. The one-month change is down roughly 22 percent and the three-month down roughly 30 percent, the unwind of a parabola that peaked near 5,700.
Yet the very short term is stabilizing. Price holds above the fast 5-day average near 4,067, momentum oscillators have pushed down into near-oversold territory, and the market defended the 4,043 area overnight. That is the familiar tension of a downtrend stretched enough to be due a relief attempt, but one that has not yet earned it. The decisive variable is not on the chart: at 8:30 a.m. ET the US employment report lands, pulled forward to Thursday for the July 4 holiday. A soft print pressures the dollar and yields and hands gold the fuel for a bounce; a firm print does the opposite and invites a retest of the recent lows. The dollar is already easing modestly into the number, a mild tailwind that does not override the corrective backdrop.
A downtrend, stretched but not turned
The oscillator picture captures the standoff. The 14-day relative-strength reading sits at 36.8, weak but not yet oversold, while stochastics are washed out in the low-20s and teens, near the oversold zone. The 14-day trend-strength index at 40.8, with negative directional pressure at 27.3 towering over positive at 11.9, describes a strong and established downtrend. The combination, a strong trend reading with momentum near oversold, is precisely the condition that produces sharp but often short-lived counter-trend bounces. Structurally the metal sits beneath the point of control of the recent distribution and has yet to reclaim it, so each rally, including the current bounce off 4,043, remains a test of whether buyers can hold a higher low rather than proof they have.
The macro cross-currents are genuinely mixed. The dollar is easing about 0.3 percent into the print, a modest tailwind, but the 10-year yield is firm near 4.49 percent, a headwind. Geopolitical headlines eased overnight as Saudi crude resumed clearing the Strait of Hormuz, trimming the safe-haven premium at the margin. On policy the Fed chair signaled that inflation concerns had decreased, a dovish lean, yet the latest projections show 9 of 18 committee participants penciling in a 2026 rate hike, a hawkish tilt. The net is a market without a clean policy steer, which throws even more weight onto the 8:30 data as the tiebreaker. Official-sector accumulation remains the slow-moving bid that has, so far, defended the 3,955 area.
The structure, level by level
The first ceiling is a tight shelf: the target near 4,080.2, the prior settlement at 4,082.4, and the 9-day crossover at 4,083.1 all group within three points, reinforced by the 4,089.9 momentum marker and the overnight high at 4,092.6. Acceptance above it opens the one-standard-deviation band at 4,109.1, then 4,120.2 and 4,128.7, the first pivot resistance at 4,151.3, the 18-day crossover at 4,184.3, and the second pivot at 4,220.1. The 4,082 to 4,093 shelf is the pivot for the whole session.
Beneath spot, immediate support is the computed pivot at 4,062.1, then the one-deviation support at 4,055.7, a momentum shelf at 4,045.0, the two-deviation support at 4,044.6, and the overnight low at 4,042.8, all bunched between 4,062 and 4,043. Below there the third-deviation support at 4,036.1 and the crossover-stall near 4,031 give way to the first pivot support at 3,993.3. The corrective structure's line in the sand is the 3,955.4 one-month and 13-week low; a decisive break reopens 3,904.1 and 3,835.3. On the gold-ETF proxy, net dealer positioning near current price is negative (call side about -80 million, put side about -309 million), which means the hedging response amplifies moves rather than dampening them, reinforcing the case to trade with a clean break rather than against it once the 8:30 reaction sets the tone.
The complete data picture
Level map (GC futures)
| Zone | Level (GC) | What it is |
|---|---|---|
| Resistance | 4,220.1 / 4,184.3 | 2nd pivot / 18-day crossover |
| Resistance | 4,151.3 / 4,128.7 / 4,120.2 | 1st pivot / 3rd, 2nd deviation bands |
| Resistance | 4,109.1 | 1st standard-deviation band |
| Pivot shelf | 4,082 to 4,093 | Prior settle 4,082.4, 9-day 4,083, o.n. high 4,092.6 |
| At market | 4,077 | Above the 5-day 4,067 only |
| Support | 4,062 to 4,043 | Pivot 4,062, bands, o.n. low 4,042.8 |
| Support | 4,036.1 / 4,031 / 3,993.3 | 3rd deviation / crossover-stall / 1st pivot |
| Support | 3,955.4 | 1-month + 13-week low (line in the sand) |
| Support | 3,904.1 / 3,835.3 | 2nd / 3rd pivot support (breakdown targets) |
By the numbers
Moving averages: 5-day 4,067.1, 20-day 4,204.2, 50-day 4,463.0, 100-day 4,715.5, 200-day 4,548.7, year-to-date 4,745.5. Stochastic %K 31.5 (9-day) / 24.9 (14-day) / 18.7 (20-day); 14-day trend index 40.8 (negative line 27.3 vs positive 11.9). Volatility: 14-day ATR 119.1 (2.90%), ADR 108.1 (2.65%), 14-day historic vol 28.8%; one-unit band roughly 3,960 to 4,190. Gold-ETF proxy near 369.91 vs prior 368.37; upper vol-inflection 360, lower 294; call side about -80M, put side about -309M; nearest major expiry mid-July. Cross-asset: Dollar Index near 101.1 (-0.3%), 10-year near 4.49%, vol index 16.65, silver a touch softer; eurozone unemployment 6.2% vs 6.3% expected.
The three paths (desk probabilities)
Path A, bearish continuation (about 45%): firm or in-line payrolls lift the dollar and yields; gold rejects 4,082 to 4,093 and works down through 4,062 to 4,043, with 3,993 the objective.
Path B, bullish relief (about 35%): soft payrolls pressure the dollar; gold reclaims 4,093 and squeezes to 4,109 and 4,120, with 4,151 the extension.
Path C, range chop (about 20%): a mixed print leaves gold oscillating between 4,043 and 4,093 with no clean resolution, favoring a stand-aside posture.
Expected range today: low band 3,993 to 4,020, most-likely pivot 4,062 to 4,082, high band 4,110 to 4,150; the full one-unit band (roughly 3,960 to 4,190) is achievable on a decisive payrolls surprise.
Today's calendar (ET)
- 8:30 a.m. · Employment package: nonfarm payrolls 113k f'cast (prior 172k), unemployment 4.3%, average hourly earnings +3.5% y/y and +0.3% m/m, private payrolls 107k, initial claims 218k (first-order catalyst)
- 10:00 a.m. · Factory orders -2% f'cast (prior +4.8%)
- Through the session · Fed Chair committee testimony (headline risk)
- Overseas · Eurozone unemployment 6.2% (a minor input)
- Friday July 3 · Market closed for the Independence Day holiday
The setup is cautiously bearish and event-gated. The base case sells a rejection of the 4,082 to 4,093 shelf after 9:45 ET, targeting 4,062, then 4,043, with 3,993 the extended objective on continuation and a stop above 4,110 where an accepted move beyond the one-deviation band and the overnight-high reclaim invalidates the thesis. The alternate is a pain-trade squeeze: on a soft payrolls surprise that drives the dollar sharply lower, a held reclaim above 4,093 targets 4,109, then 4,120, then 4,151, with a stop below 4,075. Given how much speculative length has already been flushed, momentum-following positioning is short-to-neutral, which paradoxically raises the odds of a sharp squeeze on any dovish surprise.
No entries fire in the 8:30 to 9:45 window; the opening range confirms whether the post-data move has follow-through. A decisive break, in either direction, is more likely to extend than fade under the negative-positioning backdrop, so the discipline is to trade with the break rather than against it. Gold is a compressed spring resting on a corrective structure, and the labor data decides whether it snaps toward relief or back toward the 3,955 line. Today the metal trades the payrolls, not the chart.
Trade the levels, not the noise.
AlgoIndex marks the dealer-positioning levels before each session and scores whether they hold. See the running numbers in the gamma level accuracy tracker, then view pricing.
Foundational guides: gamma exposure explained, call walls and put walls, and market internals.



