
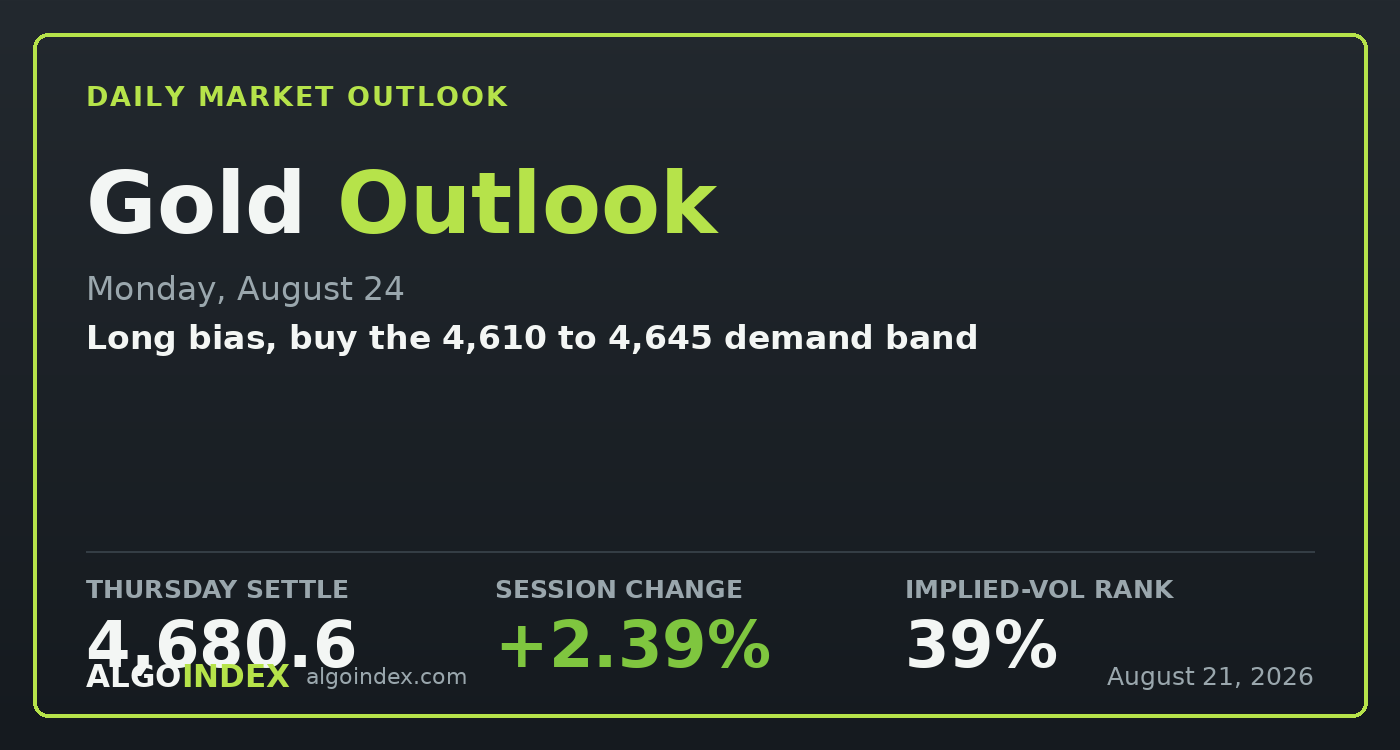
Gold ran to a fresh one-month high on Friday and closed right up against it. The December contract settled at 4,680.6, up 109.2 points, or about 2.39 percent, after tagging 4,690.4 during the day and easing only slightly into the bell. That close sits directly under a dense band of resistance, so the move isn't finished, but it's paused with the settle pressed to the top of the range. It wasn't a lazy grind either. Price opened the day session at 4,577 and never really looked back.
The push was a broad store-of-value bid rather than anything gold-specific. Silver added 2.09 percent to about 69.53, the gold-ETF proxy gained close to 2 percent, and even digital assets rallied hard, so this reads as a coordinated move into hard assets. The dollar sat flat near 98.8 and stayed in the soft trend that's helped the metal for weeks. The one input pushing back is the ten-year yield near 4.74 percent, and here the detail matters: that climb traces to larger long-end auctions and fiscal worry, not a hawkish policy turn, which is exactly why gold can keep rising through it.
Bullish, and running into supply
The trend read is strong and still building. Price holds above the five, twenty, fifty and two-hundred-day averages, the directional-movement gauge on the nine-day setting sits high near 41.8 with the positive line at 33.1 towering over the negative at 8.6, and the multi-indicator composite reads a strong buy near 72 percent. None of that's subtle. The problem sits directly overhead. The two-hundred-day average at 4,629.2 has already flipped to support beneath price, and the real wall is the 4,690 to 4,706 shelf just above the settle.
Here's the tension that sets up Monday. The fundamental side argues for more, with soft jobs and retail data, an energy-led inflation nudge, a dollar that keeps drifting lower, and a live safe-haven premium. The technical side argues the easy part is already done, with a one-month high, a settle right under a stacked resistance shelf, and stochastics pinned in the low-to-mid 90s. Both can't be right. The resolution runs through 4,706 on top and the 4,558 pivot underneath, and that's the whole map for the session.
Buy the dip, don't chase the shelf
The plan won't chase strength into 4,690. It waits for a pullback into the 4,610 to 4,645 pocket, where the 50 percent retracement, the two-hundred-day average and a former pivot now turned support all stack together. The options proxy reads net-negative dealer gamma, so intraday moves get amplified rather than pinned, and there's no tight magnet strike nearby to trap price. Implied-vol rank near 39 percent leaves plenty of room for volatility to widen. The catch is that Monday is light on data, so momentum, positioning and any weekend headline out of the Gulf carry the session.
Buy the pocket, or the clean break above 4,706
The primary plan buys a pullback into the 4,610 to 4,645 band, the 50 percent retracement and two-hundred-day confluence the uptrend needs to defend. The stop is structural below the 4,558 daily pivot, since a sustained close there flips the read from pause to reversal and opens the deeper 4,472 to 4,428 support. Targets run to the 4,690 one-month high, then the 4,706 upper shelf, then the 4,737 extension on a clean break. There's a second way in for a market that never offers the dip: a decisive reclaim and hold above 4,706 aims at 4,737 and, on follow-through, the 4,913 extension, with a stop back under 4,667. A sharp dollar rally, a hawkish real-rate turn, or a de-escalation headline that drains the geopolitical premium is a stand-aside signal whatever the chart shows. performance methodology lays out how we grade both paths.
The fundamentals say higher and the chart says stretched, and they meet at the 4,690 to 4,706 shelf. When a one-month high fades but the evening market bids it right back toward 4,661, the pullback is the trade, not the chase.
A maturing uptrend pressing a stacked resistance shelf is a buy on weakness, not a chase at the wall. The dip into 4,610 to 4,645 pays better than the print, and 4,558 is the line that says the pause turned into something worse.
This is the read our members get every session, before the bell, with the levels drawn and the setup defined. See how the same dealer-positioning work turns into systematic signals.
View pricingThe complete data picture
Every number behind Monday’s plan, charted first; the full numeric reference follows underneath.
Full numeric reference, every remaining figure from the review
| Average | Value | Settle vs |
|---|---|---|
| 5-day | 4,536.2 | above by 144.4 |
| 20-day | 4,335.7 | above by 344.9 |
| 50-day | 4,243.1 | above by 437.5 |
| 100-day | 4,484.1 | above by 196.5 |
| 200-day | 4,629.2 | above by 51.4, the nearest support |
| Level | Reference |
|---|---|
| 4,913.0 | 61.8% retracement, measured extension target |
| 4,736.9 | third standard-deviation resistance, clean-break objective |
| 4,706.5 | upper resistance shelf, second SD resistance, target 2 |
| 4,701.4 | third pivot resistance |
| 4,690 to 4,693 | one-month and thirteen-week high, target 1 |
| 4,680.6 | December settle |
| 4,667 | first-SD resistance, minor pivot on a dip |
| 4,649 | second-level pivot |
| 4,610 to 4,645 | primary demand band, entry, 50% retracement and 200-day confluence |
| 4,603 | computed target and momentum reference |
| 4,571 to 4,566 | prior close and session low |
| 4,558.2 | daily pivot, the line that separates strength from reset |
| 4,519 | first pivot support, stop shelf |
| 4,472 to 4,476 | first-SD support and 9-day average |
| 4,428 to 4,467 | second and third pivot supports, unwind zone |
| Metric | Reading |
|---|---|
| Gold-ETF proxy last | near 420 dollars after the advance |
| Implied-vol rank | about 39 percent, moderate |
| One-day options-implied move | roughly 74 gold points, options proxy |
| Call-side dealer gamma | dominant and net negative |
| Put-side dealer gamma | smaller and positive |
| Net positioning | net-negative dealer gamma, directional moves get amplified |
| Nearby magnet strike | none, the positioning field is diffuse |
| Input | |
|---|---|
| Dollar index | flat near 98.8, still a soft-trend tailwind |
| 10-year yield | near 4.74%, up on fiscal supply not policy |
| Volatility index | toward 15.1, down more than 5% |
| Silver | up 2.09% to about 69.53, tracking gold |
| Retail sales (prior) | contracting, a soft-consumer signal |
| Payrolls (prior) | deeply negative, an easier-policy input |
| Flash PMIs | strong, services near 56.8, manufacturing near 53.2 |
| Geopolitics | Iran posture, Iran-Iraq pact, Hormuz diplomacy |
| When | Event |
|---|---|
| Mon Aug 24 | data-light session, momentum and weekend geopolitics lead |
| Mid-week | Federal Reserve speaker commentary and policy-leadership headlines |
| Mid-week | marquee technology-sector earnings driving broad risk tone |
| Fri Aug 29 | US core inflation reading, first-order for gold |
The economic releases referenced above are published on the official government calendars below. Price levels are derived from standard technical and statistical methods, and the market read is AlgoIndex's own analysis. How we grade these calls is set out in our performance methodology.
- US Census Bureau, New Residential Construction (housing starts and building permits)
- US Bureau of Labor Statistics, Import and Export Price Indexes
- Federal Reserve, Industrial Production and Capacity Utilization (G.17)
- Federal Reserve, FOMC calendar and meeting minutes
- US Department of the Treasury, auction schedule and results
- AlgoIndex performance methodology



