
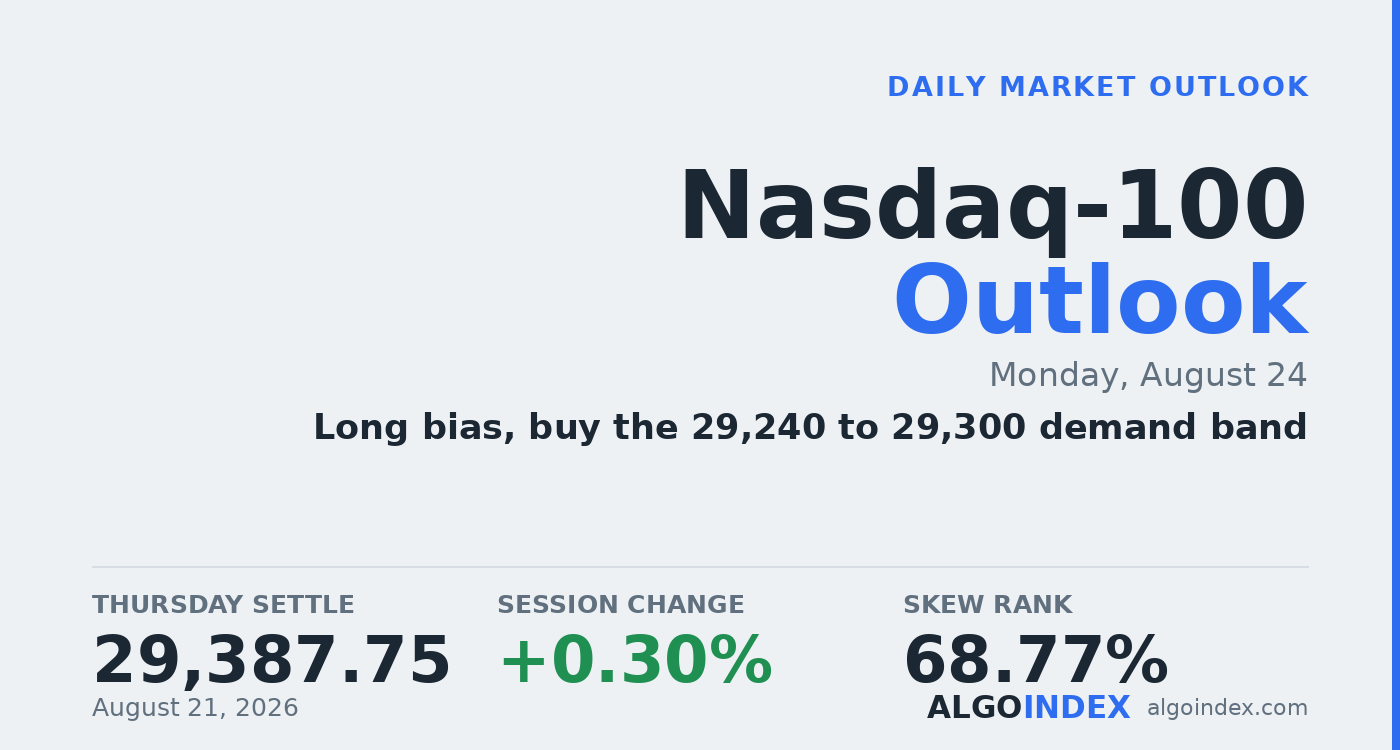
The September Nasdaq-100 added 0.30 percent on Friday and settled at 29,387.75, higher by 87.25 points, which finally broke a five-session slide that ran from Monday's 30,343.00 down to Thursday's low. The range was only 319 points and the settle landed at 52.6 percent of it, right on the day's midpoint. That's a stabilisation, not a turn, and the difference decides how Monday gets played. Price made a higher low against Thursday for the first time all week, and it did it without a supportive headline in the afternoon.
The spark was the domestic flash activity survey, which printed 56.0 against a 54.0 consensus and pushed back on the growth-scare case the market had built from a negative payrolls number and a soft retail sales figure. Even so, the contract still lost 754 points on the week, and the weekly candle closed at just 16.2 percent of its own range, which is a weak finish inside a wide down week. Underneath all of it, the medium-term driver isn't the data at all. It's the artificial-intelligence buildout, and word that a major chipmaker is chasing more than 60 billion dollars in debt wired a fresh credit channel straight into that story.
Stabilisation, not a reversal
The constructive read is location and shape. Friday printed a true inside day, the week's first higher low sat above the 29,150.75 midline of the 13-week range, and the settle recovered back above the 20-day at 29,260.94 after two probes below it. Two touches under with a close back above is a reclaim, not a break. The nine-day stochastic near 16 is depressed enough to fuel a bounce, while the 20-day near 70 still leaves room. The catch is that price is stuck below both the 5-day at 29,577 and the 50-day at 29,518, so the averages sit overhead as the first real work.
The mechanics lean the same constructive way, with a warning attached. The technology proxy carries negative dealer gamma of about 455 million dollars while the broad market carries positive gamma, and that's exactly why the Nasdaq amplifies moves the broad index cushions. Cash sits above its modeled dealer gamma flip level, and the heaviest gamma expiration already rolled off on Thursday, so much of the positioning that pinned this week is gone. The other tell is the options book: roughly six billion dollars of positive delta went through in longer-dated calls, a bet on upside into Wednesday rather than a reaction to Friday.
Wednesday decides, not Monday
The calendar does most of the talking here. Monday is a genuinely empty domestic session, with only a tentative 10:00 ET Treasury announcement that may not even happen, and that emptiness usually drifts a market toward mechanical reference points. Wednesday is the opposite, stacking core PCE, a five-year auction and the dominant chipmaker's earnings into a single day. So Monday's job is small: hold the base and let positioning build. Friday's inside range sets the boundaries at 29,539 above and 29,220 below. Through 29,539 the target is the 29,545 pivot and then 29,579; through 29,220 the path opens to 29,179 and the 29,079 gamma concentration. Between them, patience beats a chase.
Buy the base, cap into the ceiling
The plan buys the 29,240 to 29,300 shelf on a pullback, working with a low-information Monday and a reclaimed 20-day rather than chasing the ceiling that already stopped Friday twice. The stop is 29,175, tucked beneath the 29,218 to 29,226 confluence where Friday's low, the first pivot support and the translated gamma flip all sit, so three references have to fail before it's wrong, about 95 points from the middle of the entry. Targets run to the 29,390 equilibrium magnet where the settle meets Monday's pivot, then the 29,490 upper-range shelf just under the converging averages, then the 29,545 first pivot resistance on an extension through the ceiling. Reduced size, because this is entered two sessions ahead of a Wednesday that can reprice the index by several percent. There's a hard override too: any weekend energy escalation, a Treasury issuance surprise at 10:00, or a credit headline touching the AI financing complex removes the props under Friday's advance and stands the long down rather than defends it. performance methodology sets out how we grade these calls.
An inside day with the week's first higher low, sitting above the reclaimed 20-day with dealer gamma amplifying on the technology side, is a base worth buying. The whole trade is patience: Monday holds the shelf, and Wednesday decides the week.
A stabilisation session with a higher low and a reclaimed 20-day is a long worth taking on the dip, sized small. The 29,218 to 29,226 base is the line that carries it, and Wednesday's triple catalyst is the event it's really waiting on.
This is the read our members get every session, before the bell, with the levels drawn and the setup defined. See how the same dealer-positioning work turns into systematic signals.
View pricingThe complete data picture
Every number behind Monday’s plan, charted first; the full numeric reference follows underneath.
Full numeric reference, every remaining figure from the review
| Average | Value | Settle vs |
|---|---|---|
| 5-day | 29,576.60 | overhead by 188.85 |
| 20-day | 29,260.94 | 126.81 above, reclaimed support |
| 50-day | 29,517.65 | overhead by 129.90 |
| 100-day | 28,845.75 | 542.00 above, deeper support |
| 200-day | 27,265.25 | 2,122.50 above |
| Level | Reference |
|---|---|
| 30,343.00 | one-month and weekly high, origin of the decline |
| 29,925.69 | three-SD resistance projection |
| 29,863.50 | third computed pivot resistance |
| 29,701.25 | second pivot resistance, inverts the descending highs |
| 29,578.89 | upper positioning strike, top of the ceiling band |
| 29,539 to 29,545 | Friday high and first pivot, inside-day upside trigger |
| 29,517.65 | 50-day, the consequential line |
| 29,387.75 | Friday settle, sitting on Monday's pivot |
| 29,328.89 | volatility inflection, character line |
| 29,260.94 | 20-day, reclaimed and defended |
| 29,218 to 29,226 | Friday low, first pivot support and gamma flip, target base |
| 29,150.75 | 50% retracement of the 13-week range |
| 29,078.89 | primary gamma concentration, downside magnet |
| Metric | Reading |
|---|---|
| Proxy fund last | 713.00, up 0.29% |
| Total gamma notional | negative 455.40 million, short gamma |
| Broad-index gamma | positive, opposite sign |
| Gamma flip boundary | 29,217.89 futures, price above |
| Volatility inflection | 29,328.89 futures |
| Primary gamma concentration | 29,078.89 futures |
| Proxy put-to-call OI | 1.2, mild downside skew |
| Implied-vol rank | 35.57 percent proxy |
| Skew rank | 68.77 percent |
| Input | |
|---|---|
| 10-year yield | long-end yields firmed on the increased issuance sizes |
| Dollar index | softened, a support for mega-cap overseas revenue |
| WTI crude | stabilised below Thursday's one-month high |
| Volatility index | 15.14, down 6% into the monthly expiration |
| Broad index | dampened by positive dealer gamma, the Nasdaq the amplifier |
| AI capex | a major chipmaker sought 60 billion-plus in debt for capacity |
| Flash activity survey | 56.0 versus 54.0 expected, argued against the slowdown case |
| When | Event |
|---|---|
| Mon Aug 24 | empty domestic calendar, tentative Treasury announcement 10:00 |
| Wed Aug 26 | core PCE 08:30, five-year auction, dominant chipmaker earnings 16:20 |
| Fri Aug 28 | central-bank symposium, governor speaks 10:00 |
| Sep 16 | next policy decision with updated projections |
The economic releases referenced above are published on the official government calendars below. Price levels are derived from standard technical and statistical methods, and the market read is AlgoIndex's own analysis. How we grade these calls is set out in our performance methodology.
- US Census Bureau, New Residential Construction (housing starts and building permits)
- US Bureau of Labor Statistics, Import and Export Price Indexes
- Federal Reserve, Industrial Production and Capacity Utilization (G.17)
- Federal Reserve, FOMC calendar and meeting minutes
- US Department of the Treasury, auction schedule and results
- AlgoIndex performance methodology



