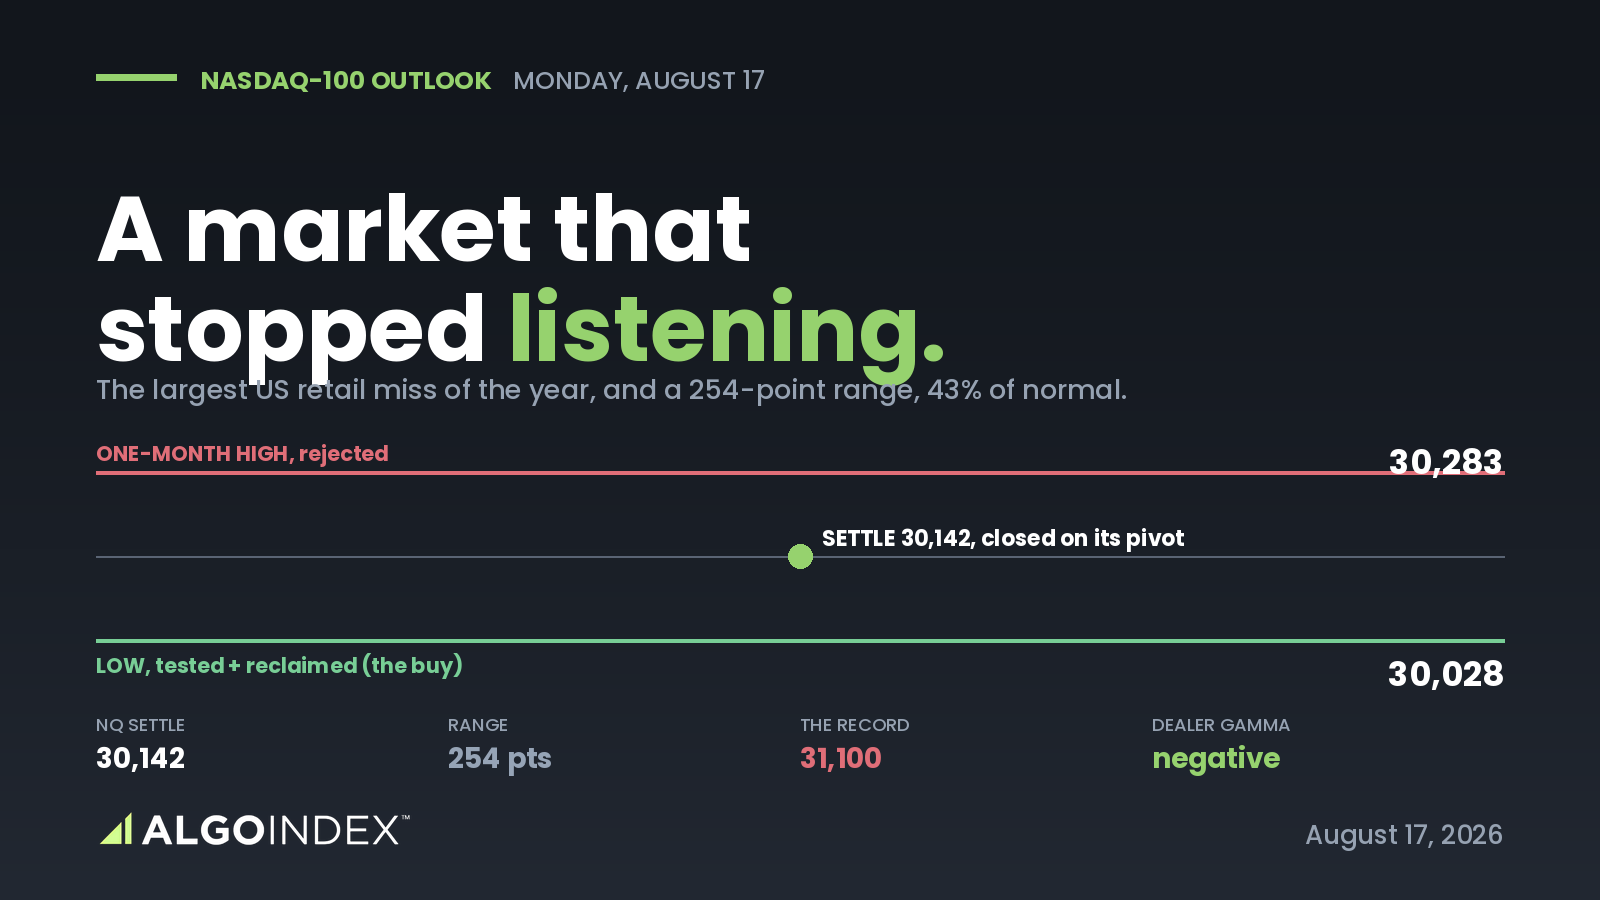
Monday's outlook sold a rebound into 28,250 to 28,310 in December Nasdaq-100 futures. The band traded on Sunday evening, when the 6:30 PM ET bar carried the 28,279.25 session high, 160.75 beneath the 28,440 stop. From there the contract fell through all three objectives at 28,120, 27,960 and 27,800. Measured from the bottom of the band, that is 130.00, 290.00 and 450.00 points, and the stop never traded.
Monday kept going. The contract settled at 27,284.25, down 750.50 or 2.68 percent, after a 1,044.50 point range, the widest since 11/09/26. It finished 49.50 above the 27,234.75 low and sits beneath every settlement average. It was the third consecutive lower settle and the third consecutive lower high.
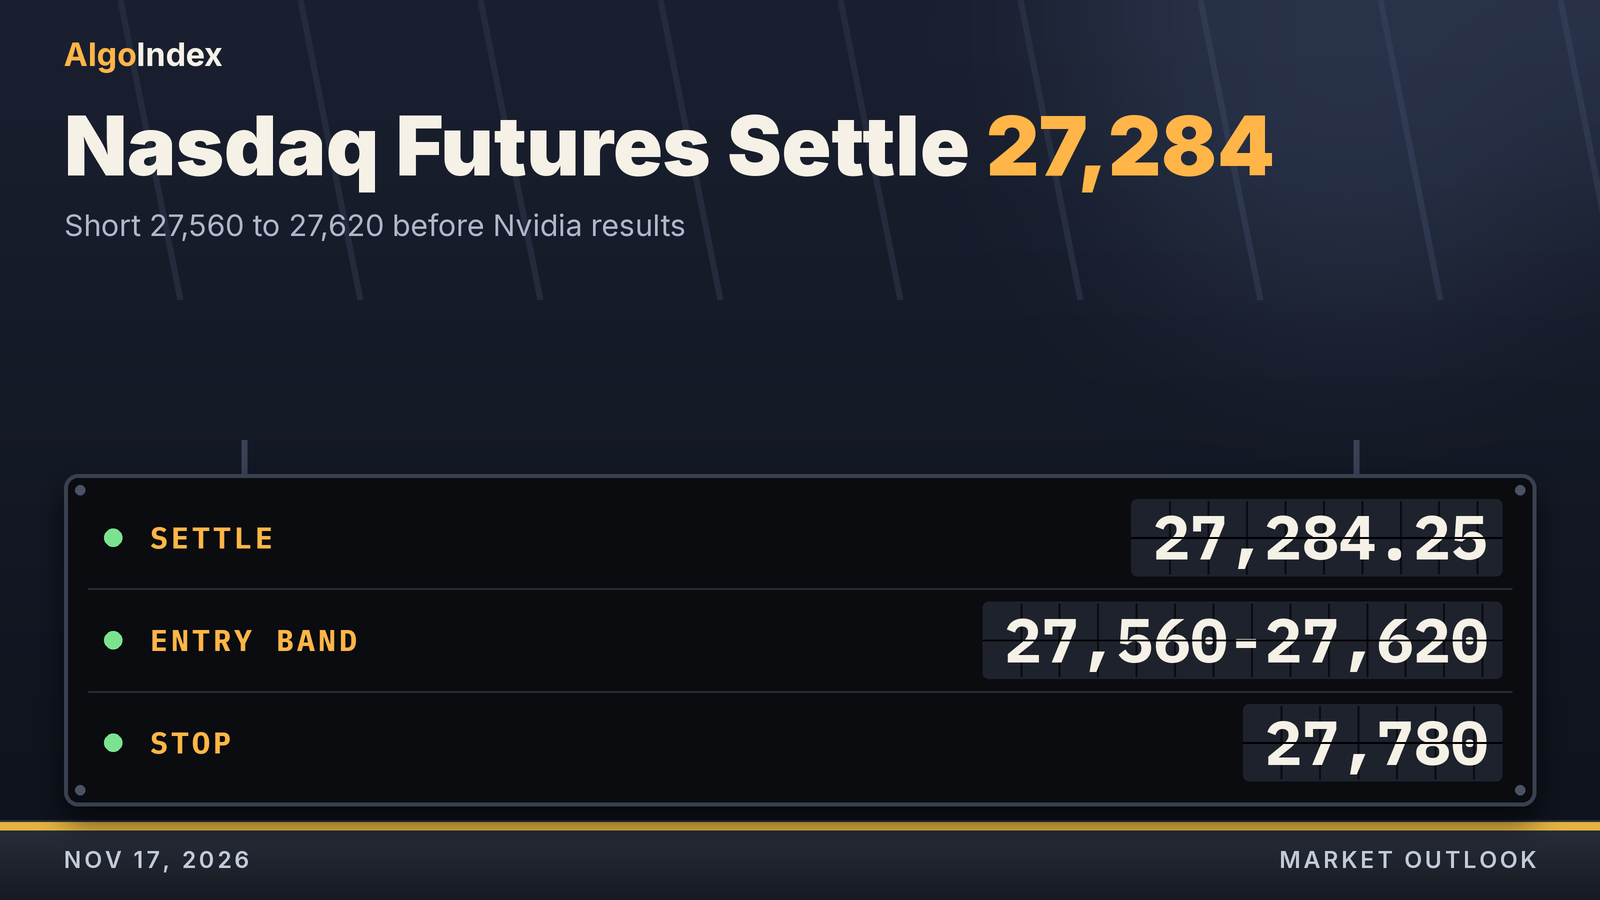
Tuesday is about one company. Nvidia's results call is set for 5:00 PM ET, after the cash close, and our plan sells a rebound into 27,560 to 27,620 before it.
At a glance
- Settle 27,284.25, down 750.50; range 27,234.75 to 28,279.25; lowest settle since 11/06/26.
- Tuesday's setup: short 27,560 to 27,620, stop 27,780, objectives 27,400, 27,210 and an extended 27,020.
- Thesis negated on a settle above one standard deviation resistance at 27,761.86; two consecutive 30-minute closes above 27,620 remove the edge.
- Dealer map: the 27,197.15 cash close sits beneath the 28,000 modeled volatility threshold (about 28,087.00 in futures) and 197.15 above the 27,000 put side support base (about 27,087.00).
- Calendar: retail sales 8:30 AM ET, industrial production 9:15 AM ET, Nvidia results call 5:00 PM ET.
How Monday traded: chipmakers dragged the index to 27,234.75
The high came first. The 6:30 PM ET bar on Sunday printed 28,279.25 and the contract traded lower through the night. By the 9:30 AM ET bar it stood at 27,716.25, and the selling into the cash session took it to the 27,234.75 low in the 3:30 PM ET bar.
The damage was broad inside technology. The semiconductor index fell 5.28 percent to 9,610.65 after a 3.43 percent decline on Friday, while the S&P 500 fell 1.92 percent. Published commentary tied the move to chipmakers and AI infrastructure stocks and to scrutiny of Nvidia over export controls after the removal of its chief executive; a press report at 12:39 PM ET said the board is not considering bringing back Jensen Huang.
Yields eased rather than rose. The ten-year yield index eased to 5.12 from 5.15 while the contract fell, the volatility index rose 3.61 points to 22.91 and the dollar index closed at 103.55. Volume rose to 880,952 contracts from 813,182, with open interest at 272,929.
Where the positioning sits
The Nasdaq-100 cash index closed at 27,197.15, beneath the 28,000 modeled volatility threshold and the 28,083 modeled gamma-flip level, and 197.15 points above the 27,000 put side support base. At Monday's measured basis of 87.10, that base corresponds to about 27,087.00 in December futures.
In our reading, a close beneath both modeled levels puts the index where hedging can add to moves. The 27,000 base is the nearest listed support, and it sits just above the 27,037.61 target price and Pivot S1 at 26,919.58.
The trade map for Tuesday
The setup sells a rebound into 27,560 to 27,620, at the Pivot Point at 27,599.42 and above the 27,522.75 midpoint of the 52-week range. The stop at 27,780 clears one standard deviation resistance at 27,761.86 and the 27,732.97 level at which price would cross the 9-day average.
Objectives sit at 27,400, above the 27,383.25 close of the 10:00 AM ET bar; 27,210, beneath Monday's 27,234.75 low; and an extended 27,020, beneath the 27,037.61 target price and above Pivot S1 at 26,919.58. From the 27,590 midpoint, risk is 190.00 points and the objectives sit 190.00, 380.00 and 570.00 points away.
The 14-day average true range is 830.01 points, so the results can carry the contract well past the stop. A rebound in chipmakers ahead of the release is the most likely route through 27,780, which would bring the 9-day average at 27,825.50 and Pivot R1 at 27,964.08 into view.
| Item | Detail |
|---|---|
| Direction | Short |
| Entry zone | 27,560 to 27,620 |
| Stop | 27,780 (above one standard deviation resistance at 27,761.86 and the 27,732.97 9-day crossing level) |
| Objective 1 | 27,400 (above the 27,383.25 close of the 10:00 AM ET bar) |
| Objective 2 | 27,210 (beneath Monday's 27,234.75 low) |
| Objective 3 (extended) | 27,020 (beneath the 27,037.61 target price, above Pivot S1 at 26,919.58) |
| Risk from band midpoint | 190.00 points |
| Invalidation | A settle above one standard deviation resistance at 27,761.86 negates the thesis. Short of that, the edge is removed by acceptance above the entry band rather than by a touch, defined as two consecutive 30-minute closes above 27,620. |
| What could change it | A rebound in chipmakers ahead of the results, a strong retail sales report with lower yields, or any early report on NVIDIA's results would lift the contract. In that scenario a move through the 27,780 stop invalidates the short before the targets, and the 9-day average at 27,825.50 becomes the reference, 45.50 beyond the stop and well inside one 14-day average true range of 830.01. |
How Tuesday could unfold
Night Session (6:00 PM ET Monday to 3:00 AM ET Tuesday, Globex/Asia)
Globex reopened at 6:00 PM ET on Monday at 27,314.75, above Monday's 27,284.25 settle. The Reserve Bank of Australia minutes are listed for 7:30 PM ET on Monday by the news-feed calendar, unconfirmed. In our judgment the overnight session is likely to hold between the 27,087.00 conversion of the index put side base and the Pivot Point at 27,599.42; expected band roughly 27,050 to 27,600.
London Session (3:00 AM to 8:00 AM ET Tuesday)
UK labor market figures are listed for 2:00 AM ET on Tuesday and the German investor sentiment survey for 5:00 AM ET by the news-feed calendar, unconfirmed. Bias neutral to lower beneath the Pivot Point at 27,599.42, expected band roughly 27,050 to 27,620.
Morning Session (9:30 AM to 12:00 PM ET Tuesday, RTH Open)
The US retail sales report is scheduled for 8:30 AM ET on Tuesday, November 17, 2026, and industrial production for 9:15 AM ET on Tuesday, November 17, 2026. The cash open at 9:30 AM ET sets the first directional test. Expected band roughly 26,950 to 27,700, with the 27,560 to 27,620 setup band near the upper edge.
Afternoon Session (12:00 PM to 4:00 PM ET Tuesday)
Remarks by New York Fed President Williams are listed for 2:25 PM ET on Tuesday by the news-feed calendar, unconfirmed, and the settlement at 4:00 PM ET fixes the reference ahead of NVIDIA's results. Expected band roughly 26,950 to 27,650, with Pivot S1 at 26,919.58 the lower reference.
Night Session Forward (6:00 PM ET Tuesday)
NVIDIA's results are listed for 4:20 PM ET on Tuesday by the news-feed calendar, unconfirmed, and the results conference call is scheduled for 5:00 PM ET on Tuesday, November 17, 2026. The reaction may extend beyond one 14-day average true range of 830.01 in either direction, and the FOMC minutes follow at 2:00 PM ET on Wednesday, November 18, 2026.
Most Likely Path
In our analyst judgment, the most probable path holds beneath the Pivot Point at 27,599.42 overnight, rebounds toward the 27,560 to 27,620 band after the US data and fails there, then trades back toward Monday's 27,234.75 low into the 4:00 PM ET settle as positioning is reduced ahead of NVIDIA's results. Three consecutive lower highs, a settle beneath every settlement average, the composite at "64% SELL" with direction "Strongest" and a cash close beneath both modeled levels support that reading, while a 9-day relative strength of 35.78 and a cash index 197.15 above the 27,000 put side base argue that a test of the base is more likely than a run through it before the results.
The alternative that would invalidate this reading is a settle above one standard deviation resistance at 27,761.86, which would bring Pivot R1 at 27,964.08 and the 28,087.00 conversion of the index threshold back into play; a rebound in chipmakers ahead of the results is the input most likely to drive that alternative. On the other side, a further decline in chipmakers could carry the contract through the 27,087.00 conversion of the put side base toward Pivot S1 at 26,919.58 without the rebound the setup needs.
The complete data picture
Every level behind Tuesday's plan, charted first; the full numeric reference from Monday's review follows underneath.
| Resistance, top to bottom | Support, top to bottom |
|---|---|
| 28,087.00 Conversion of the 28,000 index concentration | 27,234.75 Monday's session low |
| 28,002.50 5-day average | 27,128.80 Stochastic projection |
| 27,964.08 Pivot R1 | 27,087.00 Conversion of the 27,000 index put side base |
| 27,959.69 Two standard deviation resistance | 27,037.61 Published target price |
| 27,825.50 9-day average | 26,919.58 Pivot S1 |
| 27,761.86 One standard deviation resistance | 26,806.64 One standard deviation support |
| 27,732.97 9-day average crossing level | 26,751.25 Low of 11/09/26 |
| 27,716.25 High of the 9:30 AM ET bar | 26,608.81 Two standard deviation support |
| 27,616.75 High of the 11:00 AM ET bar | 26,556.63 Retracement from the 52-week low |
| 27,599.42 Pivot Point | 26,554.92 Pivot S2 |
| 27,522.75 Midpoint of the 52-week range | 26,366.50 One-month low |
| 27,512.36 Crossover stall | |
| 27,331.75 High of the 4:00 PM ET bar |
- Pivot ladder: R3 29,008.58, R2 28,643.92, R1 27,964.08, Pivot Point 27,599.42, S1 26,919.58, S2 26,554.92, S3 25,875.08.
- Index positioning converted at Monday's 87.10 point basis: put side base 27,000 to about 27,087.00, volatility threshold 28,000 to about 28,087.00, modeled gamma-flip level 28,083 to about 28,170.00, call side ceiling to about 29,762.00.
- Monday versus prior sessions: lower high 328.50 beneath Friday's, lower low 460.50 beneath Friday's; settle 995.00 beneath the high; cash index down 746.59; down 730.25 or 2.61 percent over five sessions; largest decline since the 6.35 percent drop of 11/05/26; lowest settle since 27,085.25 on 11/06/26.
Full numeric reference: every remaining figure from Monday's review
Executive Summary
The December Nasdaq-100 contract settled at 27,284.25 on Monday, down 750.50 or 2.68 percent from Friday's settle of 28,034.75, after trading between 28,279.25 and 27,234.75, a 1,044.50 point daily range. The settle finished 49.50 above the low and 995.00 beneath the high. Monday printed a lower high, 328.50 beneath Friday's 28,607.75, and a lower low, 460.50 beneath Friday's 27,695.25, and the 1,044.50 point range was the widest since the 1,378.00 point range of 11/09/26, against a published 14-day average daily range of 947.21 points.
Monday was the third consecutive lower settle and the third consecutive lower high, the settle is the lowest since the 27,085.25 settle of 11/06/26, and the 2.68 percent decline is the largest since the 6.35 percent decline of 11/05/26. Over five sessions the contract is down 730.25 from the 28,014.50 settle of 11/09/26, a decline of 2.61 percent. The settle sits beneath every settlement average from the 5-day to the 200-day, and it is the first settle beneath the 9-day average after three settles above it.
The Nasdaq-100 cash index closed at 27,197.15, down 746.59 or 2.67 percent, the S&P 500 fell 1.92 percent and the semiconductor index fell 5.28 percent. The session high of 28,279.25 printed in the 6:30 PM ET bar on Sunday evening, and the contract traded lower through the night and the cash session, from 27,716.25 in the 9:30 AM ET bar to the session low of 27,234.75 in the 3:30 PM ET bar, before settling at 27,284.25 at 4:00 PM ET.
The news feed carried at 12:39 PM ET a press report that NVIDIA's board is not considering bringing back former chief executive Jensen Huang, at 1:19 PM ET a statement from a large US bank that a technical issue was slowing transactions, later described at 4:27 PM ET as not cyber-related, and at 2:11 PM ET a report that a software bug triggered a worldwide outage at a large software company. The composite multi-indicator read published on Monday evening is "64% SELL" with strength "Average" and direction "Strongest", unchanged from "64% SELL" a session earlier.
Tuesday's setup is a short from the 27,560 to 27,620 band, at the Pivot Point at 27,599.42, stopped at 27,780, with objectives at 27,400, 27,210 and an extended 27,020. In our judgment NVIDIA's results, listed for 4:20 PM ET on Tuesday by the news-feed calendar, unconfirmed, with the results conference call scheduled for 5:00 PM ET on Tuesday, November 17, 2026, are the first-order event for this contract, and they fall after Tuesday's cash close.
Price Action & Technical Structure
Intraday and Session Review
The Monday session opened at 28,062.50 at the Sunday 6:00 PM ET reopen, 27.75 above Friday's settle and 135.25 above the 27,927.25 close of Friday's 4:30 PM ET bar. The 6:00 PM ET bar rose 130.00 and the 6:30 PM ET bar carried the session high of 28,279.25. Between the 6:00 PM ET reopen and 3:00 AM ET the 30-minute series then traded down to 27,658.00 in the 1:00 AM ET bar; the 8:00 PM ET bar fell 290.75 across a 313.75 point span, the largest decline and the widest span of any bar in the session. The window closed at 27,813.00 in the 2:30 AM ET bar.
From 3:00 AM ET to 9:30 AM ET the contract traded between 27,554.00, in the 7:30 AM ET bar, and 27,853.25, in the 3:30 AM ET bar, and closed the window at 27,669.25. The 7:00 AM ET bar fell 182.25 and the 7:30 AM ET bar recovered 124.25. The 8:30 AM ET bar, which spans the New York manufacturing survey listed for 8:30 AM ET on Monday by the news-feed calendar, unconfirmed, traded across 61.00 points and closed at 27,644.25.
Across the cash hours, from 9:30 AM ET to 4:00 PM ET, the bars held between 27,234.75, in the 3:30 PM ET bar, which carried the session low, and 27,716.25, in the 9:30 AM ET bar. The 9:30 AM ET bar fell 134.75 across a 230.50 point span and the 10:00 AM ET bar fell a further 149.25 to 27,383.25. The 10:30 AM ET bar rose 180.75 to 27,563.75, the largest gain of any bar in the session, and the 11:00 AM ET bar reached 27,616.75. The 12:00 PM ET bar fell 128.25, the 1:00 PM ET bar fell 84.75, and the 1:30 PM ET, 2:30 PM ET, 3:00 PM ET and 3:30 PM ET bars each traded down to between 27,234.75 and 27,250.00 before the settle was fixed at 4:00 PM ET at 27,284.25. From the 27,668.25 open of the 9:30 AM ET bar to the session low the contract fell 433.50 points.
After the settle the 4:00 PM ET bar reached 27,331.75 and the 4:30 PM ET bar closed at 27,285.25, 1.00 above the settle. Globex reopened at 6:00 PM ET, so the published overview, read at 6:19 PM ET, already carries the new session dated Tuesday, with an open of 27,314.75, a high of 27,360.00, a low of 27,224.25 and a previous close field of 27,284.25; those prices belong to Tuesday's session, not to Monday's.
The published Pivot Point is 27,599.42.
Daily Structure
Monday printed a lower high and a lower low against Friday and settled 750.50 lower, 49.50 above the low. Settlements over the last six sessions read 28,014.50, 27,835.25, 28,473.25, 28,384.50, 28,034.75 and 27,284.25, so the contract has fallen 1,189.00 from Wednesday's 28,473.25 settle over three sessions and holds 917.75 above the 26,366.50 one-month low of 11/06/26.
The data service publishes 26,366.50 as the one-month and 13-week low, 30,178.00 as the one-month high and 31,616.50 as the 52-week high. The settle sits 238.50 beneath the 27,522.75 level published as the 50 percent retracement of the 52-week range and 727.62 above the 26,556.63 level published as the 38.2 percent retracement from the 52-week low.
In our interpretation a wide range day that settled near its low, with the cash index down 2.67 percent and the semiconductor index down 5.28 percent, ends the recovery from the 26,366.50 low of 11/06/26 as a lower high pattern, and leaves the 26,751.25 low of 11/09/26 as the next swing reference beneath.
4-Hour and Swing Structure
The 1,044.50 point range followed ranges of 849.25 on Wednesday, 638.50 on Thursday and 912.50 on Friday. In the 30-minute series three bars spanned more than 220.00 from high to low, at 8:00 PM ET on Sunday, 9:30 AM ET and 10:30 AM ET, and three bars fell more than 145.00 from open to close, at 8:00 PM ET on Sunday, 7:00 AM ET and 10:00 AM ET.
The swing sequence since the 28,697.00 high of 11/11/26 shows three consecutive lower highs, at 28,652.25, 28,607.75 and 28,279.25. The lows read 27,516.00 on 11/10/26, 27,847.75 on 11/11/26, 28,013.75 on 11/12/26, 27,695.25 on 11/13/26 and 27,234.75 on Monday, so Monday's low sits 281.25 beneath the 27,516.00 low of 11/10/26 and 483.50 above the 26,751.25 low of 11/09/26.
Daily ranges over the last ten sessions, from 11/03/26, ran 411.25, 1,353.25, 2,098.50, 1,058.50, 1,378.00, 593.00, 849.25, 638.50, 912.50 and 1,044.50. The published grid places the 14-3 day raw stochastic projection at 20 percent at 27,128.80, the 3-10 day average crossover stall at 27,512.36, the 9-day average crossing level at 27,732.97 and the 38.2 percent retracement from the four-week low at 27,822.49.
Moving Averages
The 5-day average stands at 28,002.50, the 9-day at 27,825.50, the 20-day at 28,606.50, the 50-day at 29,675.50, the 100-day at 29,670.75 and the 200-day at 28,533.50.
The 27,284.25 settle sits 718.25 beneath the 5-day average, 541.25 beneath the 9-day, 1,322.25 beneath the 20-day, 2,391.25 beneath the 50-day, 2,386.50 beneath the 100-day and 1,249.25 beneath the 200-day. It is the second consecutive settle beneath the 5-day average, the last settle above it on 11/12/26, the first settle beneath the 9-day after three settles above it, the 24th consecutive settle beneath the 20-day and the 50-day, the last settle above both on 10/13/26, the 13th consecutive settle beneath the 100-day, the last settle above it on 10/28/26, and the eighth consecutive settle beneath the 200-day, the last settle above it on 11/04/26.
The 5-day average sits beneath the 20-day because the 15 older settlements in the 20-day window averaged higher, at 28,807.90. The 20-day sits beneath the 50-day because the 30 older settlements in the 50-day window averaged higher, at 30,388.18. The 50-day sits 4.75 above the 100-day because the 50 older settlements in the 100-day window averaged slightly lower, at 29,666.02, and the 100-day sits above the 200-day because the 100 older settlements in the 200-day window averaged lower, at 27,396.21. The 5-day average fell from Friday's 28,148.50 as Monday's settle replaced the 28,014.50 settle of 11/09/26, and the 9-day fell from 27,939.00 as the 28,305.75 settle of 11/03/26 left the window.
Oscillator and Trend Readings
The 9-day relative strength reads 35.78, the 14-day relative strength 37.07 and the 20-day relative strength 38.48.
The 9-day raw stochastic reads 35.26 percent and the 14-day raw stochastic 24.08 percent, while the 14-day stochastic %K reads 40.26 percent and the 14-day stochastic %D 46.61 percent. The 9-day directional index ADX reads 25.67 with the 9-day +DI at 15.26 and the 9-day -DI at 24.65, and the 14-day directional index ADX reads 25.28 with the 14-day +DI at 15.65 and the 14-day -DI at 25.24, so negative direction leads on both systems. The 9-day historic volatility reads 44.11 percent and the 14-day historic volatility 38.45 percent.
The composite multi-indicator read published on Monday evening is "64% SELL", with signal strength "Average" and direction "Strongest". The snapshot history reads "64% SELL" for the prior session, "80% SELL" a week ago and "40% SELL" a month ago. The short horizon group averages "80% SELL", the medium group "50% SELL" and the long group "33% SELL", and the trend composite reads "SELL".
Volatility and Expected Range
The published 14-day average true range stands at 830.01 points and the 14-day average daily range at 947.21 points; the 9-day average true range is 902.04, and the 20-day average true range is 765.42 with a 20-day average daily range of 829.94. Monday's range sat above the 14-day and 20-day averages.
Adding and subtracting the 14-day average true range of 830.01 from the 27,284.25 settle frames Tuesday between 26,454.25 and 28,114.25, rounded to the tick. The published standard-deviation bands, built from five settlements, span 26,806.64 to 27,761.86 at one deviation, 26,608.81 to 27,959.69 at two and 26,457.01 to 28,111.49 at three. These bands describe dispersion, not intraday reach. In our judgment the cash session ahead of NVIDIA's results may trade a narrower range than Monday's, with the larger move more likely after the release in the evening session.
Key Levels
Resistance
Above the 27,284.25 settle, the first references are the 27,331.75 high of the 4:00 PM ET bar, the 27,512.36 crossover stall and the 27,522.75 midpoint of the 52-week range. The Pivot Point at 27,599.42, the 27,616.75 high of the 11:00 AM ET bar and the 27,716.25 high of the 9:30 AM ET bar form the next band, followed by the 27,732.97 9-day crossing level, one standard deviation resistance at 27,761.86 and the 9-day average at 27,825.50. Two standard deviation resistance at 27,959.69 and Pivot R1 at 27,964.08 are the deeper references, with the 5-day average at 28,002.50 and our 28,087.00 conversion of the 28,000 index concentration beyond them.
Support
Beneath the settle sits Monday's 27,234.75 session low. The 27,128.80 stochastic projection, our 27,087.00 conversion of the 27,000 index put side base and the 27,037.61 target price published by the data service form the next band, followed by Pivot S1 at 26,919.58 and one standard deviation support at 26,806.64. The 26,751.25 low of 11/09/26, two standard deviation support at 26,608.81, the 26,556.63 retracement from the 52-week low and Pivot S2 at 26,554.92 are the deeper references, with the 26,366.50 one-month low beyond them.
Macro Drivers
Mag7 Earnings and AI Capex Cycle
NVIDIA's quarterly results are listed for 4:20 PM ET on Tuesday by the news-feed calendar, unconfirmed, and the results conference call is scheduled for 5:00 PM ET on Tuesday, November 17, 2026. The news feed carried at 9:34 AM ET a remark by the President that a return of Jensen Huang to NVIDIA is not a bad idea, and at 12:39 PM ET a press report that the board is not considering it and is focused on a national security investigation. At 4:46 PM ET and 4:48 PM ET the feed carried regulatory filings showing NVIDIA cut its stakes in Intel and Synopsys. The positioning note lists an estimated IPO of a large AI developer for 11/18, while the news-feed calendar lists it as tentative for 9:30 AM ET on Thursday, November 19, 2026, both unconfirmed.
Semiconductor Cycle and Tech Sector Rotation
The semiconductor index closed at 9,610.65, down 535.67 or 5.28 percent, after a 3.43 percent decline on Friday, and a press report carried by the news feed described a 5.3 percent fall in a chipmaker gauge and the Nasdaq-100 at a one-week low. At 1:35 PM ET the news feed carried remarks by a US under secretary of state that the United States has no plans to target suppliers such as ASML, Samsung or SK Hynix. At 2:11 PM ET it carried a report that a software bug undetected since July triggered a worldwide outage at a large software company. In our interpretation chip and AI infrastructure selling was the main channel for the Nasdaq-100's 2.67 percent decline, larger than the S&P 500's 1.92 percent.
Fed Policy and Real Yields (Duration Sensitivity)
The ten-year yield index closed at 5.12, down from 5.15 on Friday, so yields eased while the contract fell. The news feed carried remarks by Cleveland Fed President Hammack between 2:16 PM ET and 2:27 PM ET favoring successive rate increases and saying financial conditions are not yet restraining the economy, a news-feed report that is unconfirmed. Fed Chair Warsh gave opening remarks at 12:00 PM ET on Monday, November 16, 2026, and their content was not available. The FOMC minutes are scheduled for 2:00 PM ET on Wednesday, November 18, 2026.
Geopolitical Backdrop
The news feed carried Iranian state media reports at 3:16 PM ET and 3:25 PM ET of a fourth tanker striking a mine in the Strait of Hormuz and at 4:35 PM ET a maritime security report of an attack that disabled a tanker in the strait. The 30-minute series shows the contract between 27,234.75 and 27,379.25 from the 3:00 PM ET bar through the 4:30 PM ET bar, so no move outside that range coincided with the reports. A meeting of the US, Russian and Chinese leaders is listed for Wednesday, November 18, 2026, by the news-feed calendar, unconfirmed.
Cross-Asset and Volatility
The volatility index closed at 22.91, up 3.61 points after a 24.52 high, the dollar index at 103.55, up 0.14 percent, and December WTI crude fell 3.21 percent. The contract settled 87.10 points above the cash index's 27,197.15 close, measured as Monday's settle less the published cash close from the same completed daily records, against 91.01 on Friday. The March contract settled at 27,589.00, a premium of 304.75 over December.
Institutional Positioning
The latest weekly positioning report on the published overview, for the week to Tuesday, November 10, 2026, shows leveraged funds at 58,721 long, down 3,977, against 44,754 short, down 7,871, and asset managers at 107,927 long against 35,142 short, as listed. Monday's December volume was 880,952 contracts against 813,182 on Friday, per the settlement record, with open interest at 272,929.
QQQ Options Flow Context (Proxy)
The console, read at 6:21 PM ET, shows a current price of 661.75, down 2.67 percent from its 679.9 previous close. It places the largest gamma concentration and the primary put side support base together at 680, a secondary dealer-positioning level at 691 and the primary call side ceiling at 720, with call gamma of minus 1.57 billion dollars and put gamma of minus 2.23 billion. One-month implied volatility stands at 24.97 percent against one-month realized volatility of 34.44 percent, with an implied volatility rank of 57.96 percent and a put to call open interest ratio of 1.12. The fund's current price sits 18.25 beneath its 680 put side base.
The positioning data's Nasdaq-100 column, from the edition dated Monday, November 16, 2026 at 5:23 PM ET, uses 27,943, Friday's 27,943.74 cash close, as its reference price; Monday's 27,197.15 close is 2.67 percent beneath it. It places the modeled volatility threshold and the largest gamma concentration at 28,000, the modeled gamma-flip level at 28,083, the primary put side support base at 27,000 and the primary call side ceiling at 29,675, with key strikes listed at 28,000, 27,000, 29,000 and 30,000, a gamma tilt of 0.796 and a 25-delta risk reversal of minus 0.07. Monday's 27,197.15 cash close sits 802.85 beneath the 28,000 threshold, 885.85 beneath the modeled gamma-flip level and 197.15 above the 27,000 put side base.
The modeled threshold and flip level are model outputs, not option strikes. In our interpretation a cash close beneath both modeled levels, with the fund beneath its own put side base and negative fund gamma on both sides, describes an environment where hedging may add to moves, with the index's 27,000 base the nearest support in the positioning data.
Forecast
Night Session (6:00 PM ET Monday to 3:00 AM ET Tuesday, Globex/Asia)
Globex reopened at 6:00 PM ET on Monday at 27,314.75, above Monday's 27,284.25 settle. The Reserve Bank of Australia minutes are listed for 7:30 PM ET on Monday by the news-feed calendar, unconfirmed. In our judgment the overnight session is likely to hold between the 27,087.00 conversion of the index put side base and the Pivot Point at 27,599.42; expected band roughly 27,050 to 27,600.
London Session (3:00 AM to 8:00 AM ET Tuesday)
UK labor market figures are listed for 2:00 AM ET on Tuesday and the German investor sentiment survey for 5:00 AM ET by the news-feed calendar, unconfirmed. Bias neutral to lower beneath the Pivot Point at 27,599.42, expected band roughly 27,050 to 27,620.
Morning Session (9:30 AM to 12:00 PM ET Tuesday, RTH Open)
The US retail sales report is scheduled for 8:30 AM ET on Tuesday, November 17, 2026, and industrial production for 9:15 AM ET on Tuesday, November 17, 2026. The cash open at 9:30 AM ET sets the first directional test. Expected band roughly 26,950 to 27,700, with the 27,560 to 27,620 setup band near the upper edge.
Afternoon Session (12:00 PM to 4:00 PM ET Tuesday)
Remarks by New York Fed President Williams are listed for 2:25 PM ET on Tuesday by the news-feed calendar, unconfirmed, and the settlement at 4:00 PM ET fixes the reference ahead of NVIDIA's results. Expected band roughly 26,950 to 27,650, with Pivot S1 at 26,919.58 the lower reference.
Night Session Forward (6:00 PM ET Tuesday)
NVIDIA's results are listed for 4:20 PM ET on Tuesday by the news-feed calendar, unconfirmed, and the results conference call is scheduled for 5:00 PM ET on Tuesday, November 17, 2026. The reaction may extend beyond one 14-day average true range of 830.01 in either direction, and the FOMC minutes follow at 2:00 PM ET on Wednesday, November 18, 2026.
Expected Range (Tuesday Full Session)
- Low-range scenario: 27,000 to 27,600
- Mid-range scenario (most likely): 26,800 to 27,800
- High-range scenario: 26,500 to 28,100
Most Likely Path
In our analyst judgment, the most probable path holds beneath the Pivot Point at 27,599.42 overnight, rebounds toward the 27,560 to 27,620 band after the US data and fails there, then trades back toward Monday's 27,234.75 low into the 4:00 PM ET settle as positioning is reduced ahead of NVIDIA's results. Three consecutive lower highs, a settle beneath every settlement average, the composite at "64% SELL" with direction "Strongest" and a cash close beneath both modeled levels support that reading, while a 9-day relative strength of 35.78 and a cash index 197.15 above the 27,000 put side base argue that a test of the base is more likely than a run through it before the results.
The alternative that would invalidate this reading is a settle above one standard deviation resistance at 27,761.86, which would bring Pivot R1 at 27,964.08 and the 28,087.00 conversion of the index threshold back into play; a rebound in chipmakers ahead of the results is the input most likely to drive that alternative. On the other side, a further decline in chipmakers could carry the contract through the 27,087.00 conversion of the put side base toward Pivot S1 at 26,919.58 without the rebound the setup needs.
Tuesday Economic Calendar
Monday's releases are complete. The New York manufacturing survey was released at 8:30 AM ET on Monday at 7.80 against a forecast of 18 and 25.50 previously, per the news-feed calendar and unconfirmed. Fed Chair Warsh gave opening remarks at 12:00 PM ET on Monday, November 16, 2026, and their content was not available. The December contract settled at 4:00 PM ET at 27,284.25.
Tuesday brings the US retail sales report and import prices at 8:30 AM ET on Tuesday, November 17, 2026, Home Depot's results at 9:00 AM ET on Tuesday, November 17, 2026, and industrial production at 9:15 AM ET on Tuesday, November 17, 2026. Business inventories follow at 10:00 AM ET on Tuesday, November 17, 2026.
Remarks by Fed Governor Waller are listed for 9:10 AM ET on Tuesday by the news-feed calendar, unconfirmed. Remarks by Cleveland Fed President Hammack are listed for 9:30 AM ET on Tuesday and by New York Fed President Williams for 2:25 PM ET on Tuesday by the news-feed calendar, unconfirmed. NVIDIA's results are listed for 4:20 PM ET on Tuesday by the news-feed calendar, unconfirmed, and the results conference call is scheduled for 5:00 PM ET on Tuesday, November 17, 2026.
Later in the week, the FOMC minutes are scheduled for 2:00 PM ET on Wednesday, November 18, 2026. The positioning note lists the volatility index expiration on 11/18 and monthly options expiration on 11/20, both unconfirmed. In our judgment NVIDIA's results after Tuesday's close are the first-order event for this contract, with the 8:30 AM ET retail sales report on Tuesday, the main input for the cash session.
Sources and methodology
Prices, settlements and volume come from the exchange settlement record and the daily series for the December contract (NQZ26). Session timing comes from Monday's 30-minute bars. Moving averages were computed from completed daily settlements; oscillators, the composite read and the pivot ladder are quoted as published. Positioning levels come from the Nasdaq-100 tracking fund's positioning console and an options positioning data set; futures equivalents use Monday's measured basis of 87.10 points.
The prior card is graded only on its own levels, across Monday's full session; an objective counts only when it traded after the band first traded.
Three lower highs in a row set the tone; the results set the next move.
This article is market commentary for educational purposes and is not investment advice. Futures and options trading involves substantial risk of loss and is not suitable for every investor. Past results do not guarantee future results.