
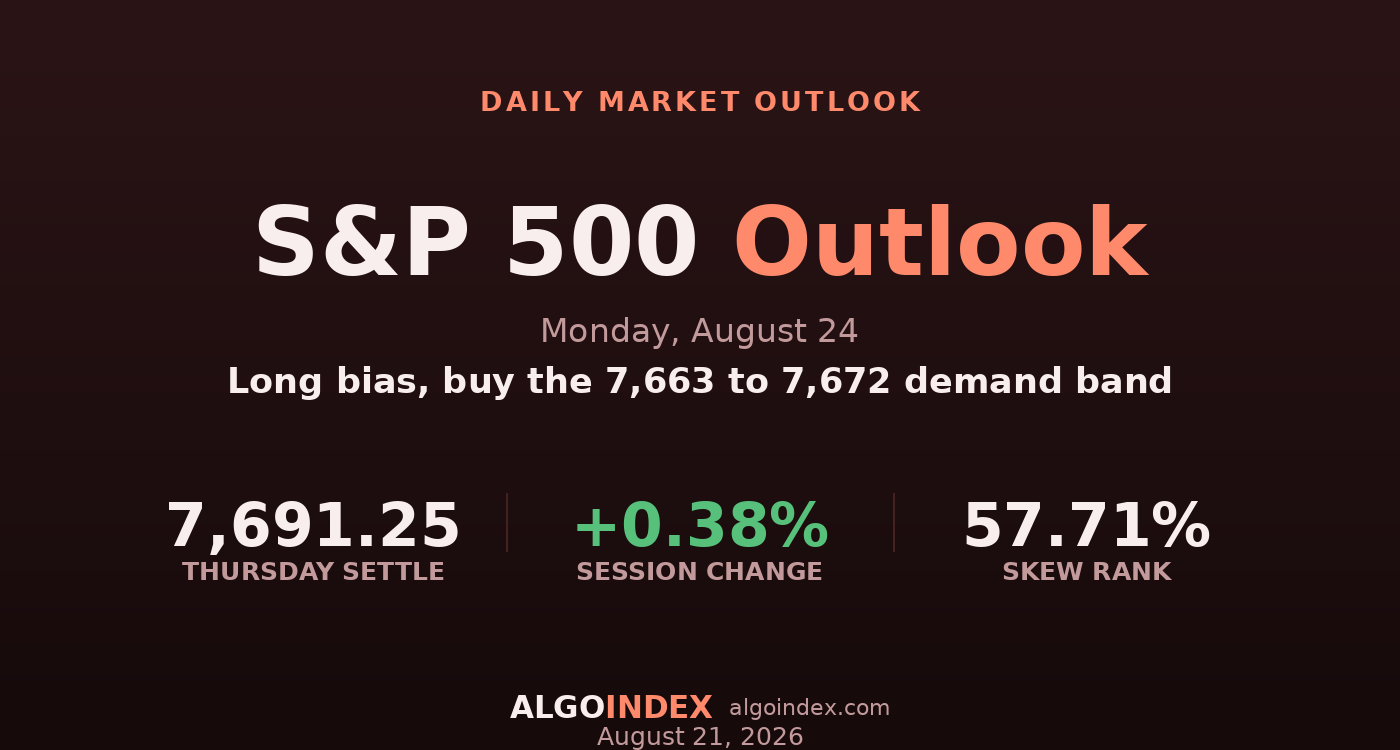
The September E-mini settled at 7,691.25 on Friday, up 28.75 points, and the cash index tacked on 0.43 percent to close near 7,674. The gain reads better than the session felt. Buyers ran the contract to 7,714.00 by late morning and then handed back the top quarter of the range into the bell, which is what a market does when it bumps a supply shelf rather than clearing it. The push had real fuel behind it. Crude cooled off its one-month high after Iran's president called for an end to the war, a strong flash services print landed mid-morning, and that mix lifted everything from small caps to gold.
Here's the catch. Friday was monthly expiration, and a large block of customer call ownership sits at cash 7,700, which lines up almost exactly with the 7,714 futures high. When price walked into that strike near 11:50 in the morning, dealers who were short those calls sold the futures they'd been holding against them, and cumulative hedging flow flipped from a positive 5 billion dollar reading to a negative 2 billion into the close. That reversal wasn't about the news. It was mechanical, and the same supply is still parked overhead for Monday.
Constructive close, hard ceiling
The bull case is location. Price finished above the dealer gamma flip level at 7,673.10 in the futures, and in that zone hedging activity dampens swings instead of feeding them, which is the plain reason Friday's band stayed narrow. The nine-day raw stochastic at 18.53 percent marks a washed-out short-term reading while the 20-day near 71 keeps the longer uptrend intact, the split that argues for stabilization rather than another leg down. Underneath, the 20-day average at 7,670.10 sits three points beneath the flip, so the two lines form a real shelf rather than a single line that can be poked and lost.
The problem is what's directly overhead. The five-day average at 7,713.10, Friday's 7,714.00 high, and the first pivot resistance at 7,716.42 all stack inside four points of each other, and the heaviest call concentration in the cash index sits right at 7,700. Getting through that band takes either enough demand to soak up the dealer hedging supply or a repricing of the strike itself, and neither is a given on a Monday that carries almost nothing on its calendar. So the setup is a long from support, not a chase of the highs.
The 7,700 strike is the wall
Two bands define Monday. Overhead, 7,709.10 is the first barrier and 7,713 to 7,716 is the dense confluence where the five-day average, Friday's high, the first pivot, and the mechanical hedging ceiling all meet. Below, 7,688.83 is the pivot and the 7,670 to 7,673 shelf pairs the 20-day with the gamma flip. Implied-vol rank at 14.54 says movement is cheap, one-month implied is actually running under realized, and skew rank near 58 is only moderate, so this isn't a market bracing for a shock. It's insured from an earlier week and a little complacent.
Buy the shelf, respect the ceiling
The plan buys the 7,663 to 7,672 support confluence and leans on the dampening environment rather than betting on a trend, because Monday's own at-the-money volatility priced in around 6 percent points to a quiet, mean-reverting session. The stop is 7,646, beneath the one-standard-deviation support at 7,651 and beneath the gamma flip, the level where the stabilizing hedging mechanism inverts, about 21.5 points from the middle of the entry. Targets run to the 7,689 pivot, then the 7,712 five-day average and Friday high, then 7,739 only if the 7,716 ceiling clears on expanding volume. Two things can void it in real time: a Treasury announcement at 10:00 in the morning that tightens Iranian supply and shoves crude decisively higher, or any weekend escalation that gaps the market beneath the shelf on the Sunday reopen. Our published record shows how we grade these calls.
The market closed above the flip level in a positive-positioning setup that quiets downside, but a demonstrated block of hedging supply sits right at 7,700. Constructive underneath, capped on top.
A washed-out oscillator into a positive-gamma close is a dip worth buying at reduced size. The edge is the 7,663 to 7,672 shelf, and the failure is 7,646.
This is the read our members get every session, before the bell, with the levels drawn and the setup defined. See how the same dealer-positioning work turns into systematic signals.
View pricingThe complete data picture
Every number behind Monday’s plan, charted first; the full numeric reference follows underneath.
Full numeric reference, every remaining figure from the review
| Average | Value | Settle vs |
|---|---|---|
| 5-day | 7,713.10 | below by 21.85 |
| 20-day | 7,670.10 | above by 21.15 |
| 50-day | 7,583.50 | above by 107.75 |
| 100-day | 7,441.06 | above by 250.19 |
| 200-day | 7,196.32 | above by 494.93 |
| Level | Reference |
|---|---|
| 8,019.10 | primary gamma concentration strike, cash 8,000 |
| 7,919.10 | primary call-side ceiling, cash 7,900 |
| 7,838.50 | 52-week high, cash 7,822, set Aug 13 |
| 7,741.58 | second pivot resistance, cash 7,725 |
| 7,716.42 | first pivot resistance and mechanical ceiling, cash 7,700 |
| 7,713.10 | five-day average and Friday's 7,714 high |
| 7,709.10 | volatility inflection level, cash 7,690 |
| 7,691.25 | September settle |
| 7,688.83 | pivot point, cash 7,672 |
| 7,673.10 | dealer gamma flip level, cash 7,654 |
| 7,670.10 | twenty-day average, cash 7,653 |
| 7,663 to 7,672 | primary demand band, the entry |
| 7,651.29 | one-SD support, cash 7,634, stop shelf |
| 7,636.08 | second pivot support, cash 7,619 |
| 7,519.10 | primary put-side support base, cash 7,500 |
| Metric | Reading |
|---|---|
| Call gamma | 1.94 billion |
| Put gamma | negative 1.33 billion |
| Net gamma | positive 0.61 billion, index above the flip |
| Full-day cash index hedging flow | negative 2 billion delta, zero-day call selling |
| Customer long calls at 7,700 | about 15,000 lots, the mechanical ceiling |
| Put-to-call open interest | 1.375, volume near parity at 1.025 |
| 25-delta risk reversal | negative 0.045 |
| Implied-vol rank | 14.54 percent |
| Skew rank | 57.71 percent |
| Cohort | Weekly change |
|---|---|
| Asset managers | net long, 1,165,359 long vs 204,793 short, added 10,659 longs |
| Leveraged funds | net short, 447,693 short vs 166,291 long, cut both sides hard |
| Dealers and intermediaries | structurally short, 1,004,401 vs 219,986, still adding |
| Non-commercials | near flat, 285,875 short vs 275,315 long, tilting short |
| Input | |
|---|---|
| Long-end Treasury yields | 10-year up 0.025 to 4.722%, term premium elevated |
| Dollar index | 98.839, unchanged, no currency variable |
| Crude oil | 87.06, up 0.26%, Iran de-escalation on the surface |
| Volatility index | 15.14, down 5.49% |
| Gold | 4,680.6, up 2.39%, debasement bid intact |
| Bitcoin | 78,497, up 7.51% to a three-month high |
| When | Event |
|---|---|
| Mon Aug 24 | Treasury Secretary announcement 10:00, tentative, Iran isolation plan, otherwise light |
| Tue Aug 25 | consumer confidence and new home sales 10:00, two-year auction 1:00 |
| Wed Aug 26 | core inflation gauge, second-estimate GDP, durable goods 8:30, Nvidia report 4:20 |
| Aug 27-29 | jobless claims 8:30, central-bank symposium opens, Warsh address Aug 28 10:00 |
| Wed Sep 16 | rate decision with updated projections |
The economic releases referenced above are published on the official government calendars below. Price levels are derived from standard technical and statistical methods, and the market read is AlgoIndex's own analysis. How we grade these calls is set out in our performance methodology.
- US Census Bureau, New Residential Construction (housing starts and building permits)
- US Bureau of Labor Statistics, Import and Export Price Indexes
- Federal Reserve, Industrial Production and Capacity Utilization (G.17)
- Federal Reserve, FOMC calendar and meeting minutes
- US Department of the Treasury, auction schedule and results
- AlgoIndex performance methodology



