
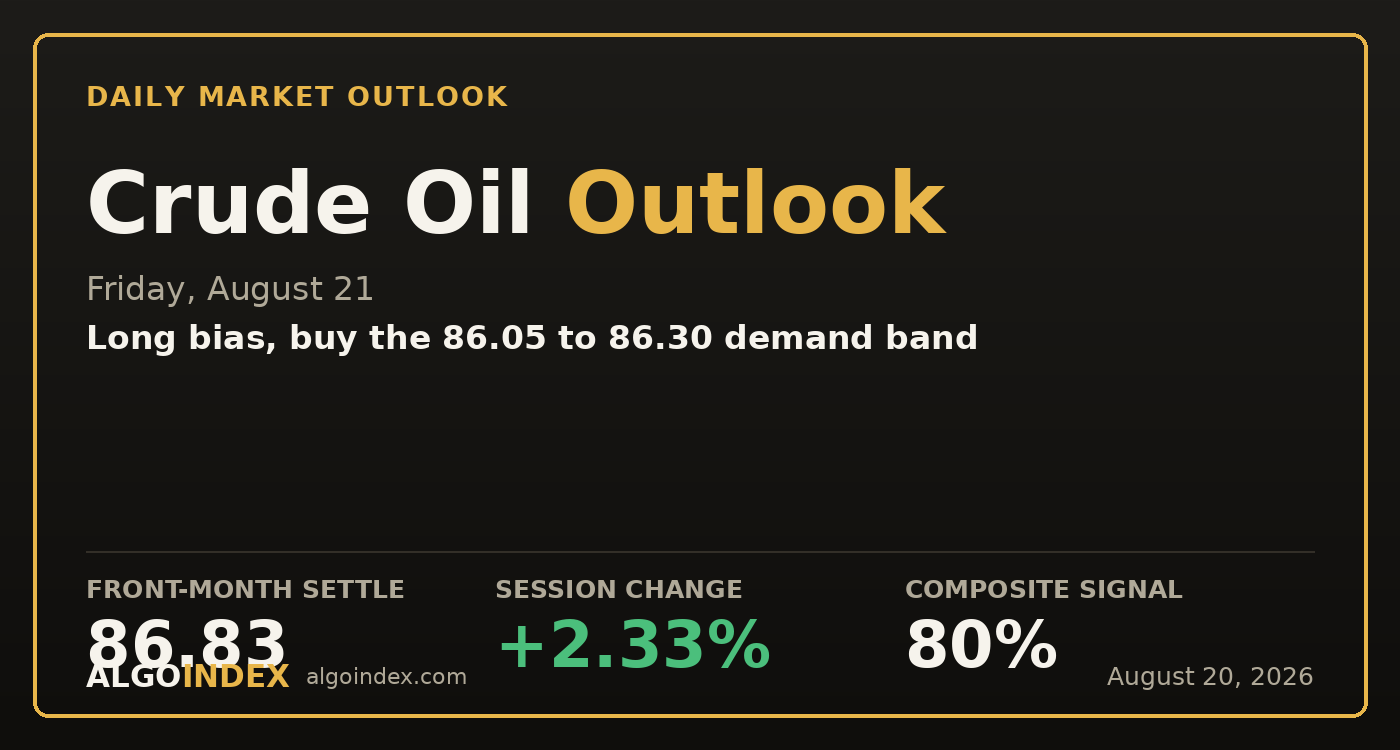
Crude closed a fourth straight advancing session at a one-month high, and the driver was a headline rather than a barrel. The expiring September contract carried the day, settling at 87.83 and up 2.33 percent, while October, the new front month that anchors every level here, settled a dollar lower at 86.83. That one-dollar gap is a contract roll, not a decline, so a screen quote near 86.83 against a 87.83 headline isn't a sell-off. The move came late in the day, when the President threatened to crush Iran's economy and the Treasury Secretary confirmed an isolation plan for Monday.
The settle looks commanding and the electronic close doesn't agree. October settled at 86.83, its high-water mark of conviction, then reopened at 86.27, traded down to 86.06, and sits near 86.62. That's a close beneath the settle, the opposite of the prior session's tone, and it says the buyers who lifted crude on the Iran headline didn't stay for the evening. Layer on stochastics pinned above 90 on nearly every window and a five-day gain of 6.47 percent, and the market enters Friday strong, stretched, and short of fresh fuel until Monday.
The strait stays shut while the barrels reroute
The supply case is intact and it's political to the core. The Strait of Hormuz remains closed, an adviser to the Supreme Leader has said it won't reopen until Iran's conditions are met, and a second chokepoint is now in play as Houthi forces move on territory at Bab el Mandeb. The curve backs the story: one-dollar backwardation in the front spread, a Brent premium near six dollars, and a distillate crack close to 100 dollars a barrel. The trend readings agree, accelerating on every window with the positive directional line leading throughout and no inversion anywhere.
The offsets are slower and structural. China is buying more Russian crude to cover the missing Iranian barrels, which quietly trims the effective supply loss one cargo at a time. Demand data has softened too, with prior retail sales down 0.6 percent and payrolls at minus 23,000, though crude has ignored both while the supply story runs. And refined products aren't following: gasoline rose only 0.24 percent against crude's 2.33 percent, so the crack compressed on the day. That's a risk premium on the barrel, not a demand pull through the refinery.
A stretched advance into a weekend it can't resolve
The setup is a pullback purchase, and it isn't a breakout chase. Four advancing sessions, a close beneath the session average price, short-window stochastics above 90, and a range that ran hot at 3.46 dollars all describe a market that's earned a rest before it extends. Crude carries no listed options surface, so the read comes from the physical complex, and there it still points higher: backwardation, a Brent premium above five dollars, and a distillate crack near 100. The overriding risk sits off the chart. A Hormuz reopening removes the supply premium in minutes, and the early-August drop to 73 is the reference for how fast that travels.
Buy the dip, honor the shelf, respect Monday
The plan buys the 86.05 to 86.30 band on a pullback, the area built by the 86.25 pivot, the 86.26 stochastic stall, and the 86.06 session low, rather than chasing a ceiling that already stopped the advance. The stop is 85.10, beneath both the 85.32 first-deviation support and the 85.15 five-day average, so it exits under the first genuine shelf rather than inside it, about 1.08 of risk from the middle of the entry. Targets run to Thursday's 87.69 high, then the 88.27 pivot with the 88.34 deviation just above, then the 89.29 envelope top. A thirty-minute close beneath 84.81 breaks the three-way shelf and voids the broader bias, and any credible Hormuz-reopening headline voids the long at any price, which is why size stays built for Monday's gap rather than Friday's range. performance methodology sets out how we grade the result.
The strait's shut, a second chokepoint is stirring, and crude still gave back most of two dollars to close beneath its settle. The trade is the pullback into support, with the whole structure hostage to a headline the chart can't price.
An accelerating supply trend meeting its first evening seller is a buy on the dip, not a chase at the ceiling. Buy 86.20, honor 85.10, and size for Monday's gap, because that's where this really resolves.
This is the read our members get every session, before the bell, with the levels drawn and the setup defined. See how the same dealer-positioning work turns into systematic signals.
View pricingThe complete data picture
Every number behind Friday’s plan, charted first; the full numeric reference follows underneath.
Full numeric reference, every remaining figure from the review
| Average | Value | Settle vs |
|---|---|---|
| 5-day | 85.15 | above by 1.68 |
| 20-day | 80.72 | above by 6.11 |
| 50-day | 77.38 | above by 9.45 |
| 100-day | 79.78 | above by 7.05 |
| 200-day | 71.35 | above by 15.48 |
| Year-to-date | 74.65 | above by 12.18 |
| Level | Reference |
|---|---|
| 91.20 to 91.73 | strength-index ceiling, second and third pivot resistance |
| 89.29 to 89.71 | one-ATR envelope top, second pivot resistance |
| 88.27 to 88.54 | tightest resistance confluence, thirteen-week high, target 2 |
| 88.07 | one-month high from July 23 |
| 87.69 to 87.95 | session-high band, target 1 |
| 86.94 | electronic-session high, first ceiling |
| 86.83 | October settle |
| 86.05 to 86.30 | entry band, pivot pair and session low |
| 85.15 to 85.32 | five-day average and first-SD support, stop shelf |
| 84.70 to 84.81 | three-way confluence shelf, invalidation |
| 84.22 to 84.23 | session low, three-SD support |
| 82.35 | 38.2% retracement of the four-week high |
| 80.36 to 80.60 | largest volume node, deep support |
| 73.10 | one-month low, recovery base |
| Metric | Reading |
|---|---|
| Term structure | backwardation, September 87.83 vs October 86.83, one dollar |
| Brent-WTI differential | Brent 93.78, 5.95 over WTI, well above the 3 to 4 norm |
| Distillate crack | near 100 dollars per barrel |
| Gasoline crack | near 49 dollars, compressed as gasoline rose only 0.24% |
| Natural gas | settled 2.7330, down 2.88%, a crude-specific move |
| Listed options surface | not available for crude |
| Cohort | Weekly change |
|---|---|
| Commercials | net short 129,637; shorts cut 14,319, longs added 9,819 |
| Non-commercials | net long 99,196; shorts added 19,252 vs 6,005 longs |
| Managed money | net long 79,916; shorts added 8,078 vs 1,036 longs |
| Swap dealers | shorts 578,142, cut 18,146 (data Aug 11, stale) |
| Input | |
|---|---|
| Retail sales (prior) | minus 0.6% vs plus 0.1% forecast |
| Payrolls (prior) | minus 23,000 vs plus 80,000 forecast |
| Dollar index | 98.70, down 0.14%, mild tailwind |
| 10-year yield | 4.700%, effectively unchanged |
| 30-year yield | 5.19%, down 9.2 bps on Treasury buyback |
| Gold | 4,595.70, up 0.53% |
| Volatility index | 16.02, up 7.66%, risk-off except energy |
| Iran policy | President threatened Iran's economy; isolation plan due Monday |
| When | Event |
|---|---|
| Fri Aug 21 | global flash PMIs, US composite 09:45, no energy release |
| Mon Aug 24 | administration's Iran-isolation plan, weekend gap risk |
| Tue Sep 9 | government short-term energy outlook |
| Wed Sep 10 | producer group monthly report |
| Sep 16 | Federal Reserve rate decision and projections |
The economic releases referenced above are published on the official government calendars below. Price levels are derived from standard technical and statistical methods, and the market read is AlgoIndex's own analysis. How we grade these calls is set out in our performance methodology.
- US Census Bureau, New Residential Construction (housing starts and building permits)
- US Bureau of Labor Statistics, Import and Export Price Indexes
- Federal Reserve, Industrial Production and Capacity Utilization (G.17)
- Federal Reserve, FOMC calendar and meeting minutes
- US Department of the Treasury, auction schedule and results
- AlgoIndex performance methodology



