
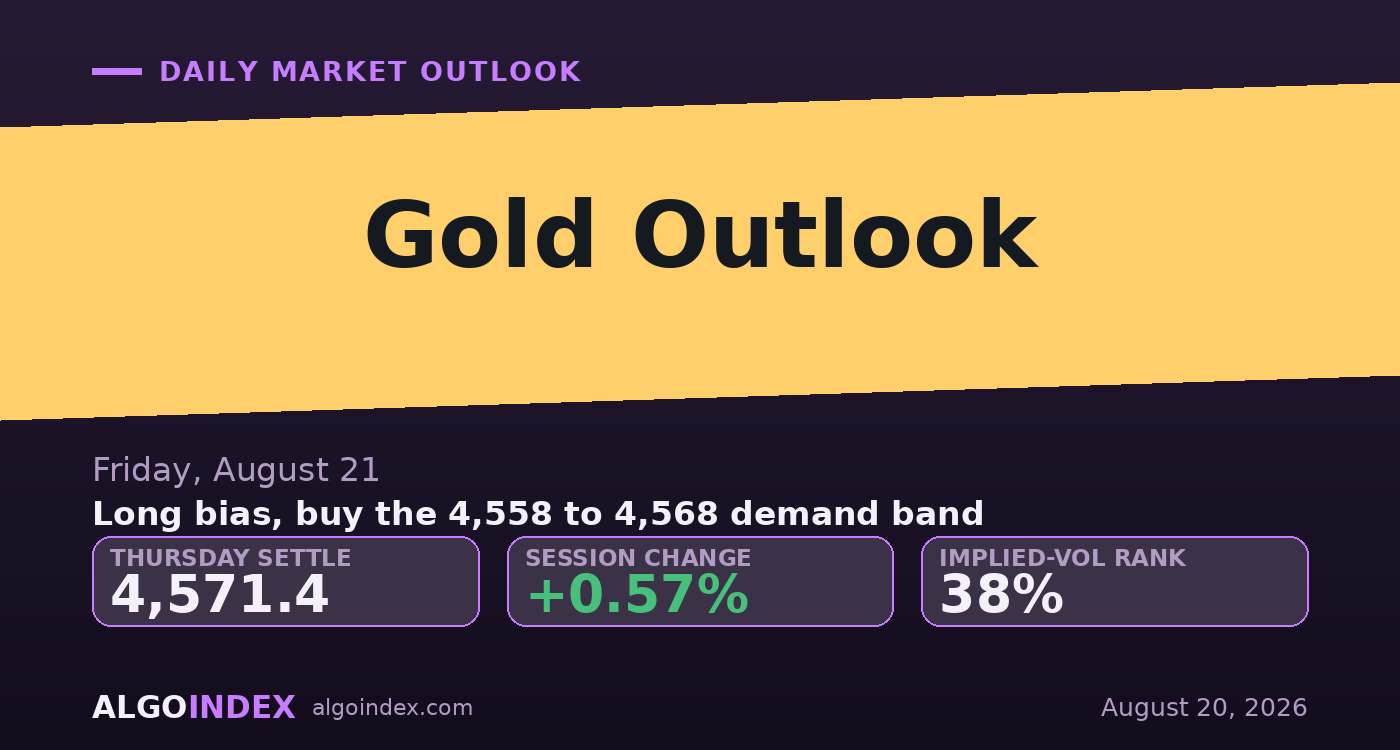
Gold pressed to a fresh one-month high on Thursday and then handed a little of it back. The December contract settled at 4,571.4, up about half a percent on the session, after tagging 4,600.3 during the day and fading into the close. That fade left a modest upper wick, and it's the market saying plainly that 4,600 is where the sellers live. The move isn't finished, though. It has just paused beneath a ceiling.
The story into Friday is a rotation toward safety, not a gold-specific spark. Equity index futures slid, the volatility gauge jumped almost eight percent to 16.02, and money rolled into the metals while silver ran up 1.37 percent overnight. The dollar sat soft at 98.71, which helps, but the ten-year yield near 4.70 percent didn't fall, and that's the one input working against the metal. Soft labor and consumption data, an energy-led inflation bump, and an unresolved standoff in the Gulf round out a backdrop that leans the metal's way.
Bullish, but bullish into resistance
The trend structure is strong and still maturing. Price holds above the five, twenty, fifty and one-hundred-day averages, the directional read is firmly positive with the plus line more than double the minus line, and the multi-indicator composite reads 72 percent buy. None of that is subtle. The catch sits directly overhead: the 200-day average at 4,628.9 caps the next leg, and fourteen-day momentum has climbed into the high 60s. The trend is up. It's running straight into supply.
Here's the tension that defines the next session. The fundamental case argues for more upside, soft US jobs and retail data, an energy-led inflation nudge, a dollar-negative buyback expansion, and a live safe-haven bid. The technical case argues the easy money is already made, a one-month high, price beneath the 200-day, and stochastics pinned above 99. Both can't win. The resolution runs through 4,600 on top and the 4,558 pivot underneath, and that's the whole map for Friday.
Buy the hold, don't chase the ceiling
The plan won't chase strength into 4,600. It waits for a pullback into the 4,558 to 4,568 confluence, where the daily pivot and Thursday's prior low line up and the uptrend should defend. The options proxy reads short gamma, so intraday moves get amplified rather than pinned, and there's no tight magnet strike nearby to trap price. Implied-vol rank near 38 percent leaves room for volatility to expand if the 09:45 surveys surprise. That morning survey batch is the real swing factor. A soft set feeds the dovish story and a push through 4,600; a hot set lifts yields and the dollar and sends the metal back toward 4,519.
Buy the pivot hold, or the clean break above 4,610
The primary plan buys a pullback into the 4,558 to 4,568 band, the daily pivot and prior-low confluence the uptrend needs to hold. The stop sits below 4,519, beneath first pivot support, so a sustained 4-hour close there flips the read from pause to reversal, about 44 points of risk from the middle of the entry. Targets run to the 4,600 supply shelf, then the 4,628 200-day, then the 4,644 to 4,649 grouping. There's a second way in for a market that never offers the dip: a decisive reclaim and hold above 4,610 targets the 4,628 200-day and, on a break, 4,644 to 4,674, with a stop back below 4,600. A hot 09:45 survey that lifts yields and the dollar hard is a stand-aside signal until price steadies. performance methodology lays out how we grade both paths.
The fundamentals say higher and the chart says stretched, and both meet at 4,600. When a one-month high fades but the after-hours market bids it right back toward 4,590, the pullback is the trade, not the chase.
A maturing uptrend running into its 200-day is a buy on weakness, and it's not a chase at the wall. The dip into 4,560 pays better than the print, and 4,519 is the line that says the pause became something worse.
This is the read our members get every session, before the bell, with the levels drawn and the setup defined. See how the same dealer-positioning work turns into systematic signals.
View pricingThe complete data picture
Every number behind Friday’s plan, charted first; the full numeric reference follows underneath.
Full numeric reference, every remaining figure from the review
| Average | Value | Settle vs |
|---|---|---|
| 5-day | 4,521.6 | above by about 50 |
| 20-day | 4,332.0 | above by about 239 |
| 50-day | 4,241.6 | above by about 330 |
| 100-day | 4,483.4 | above by about 88 |
| 200-day | 4,628.9 | below by about 57, the next test |
| Year-to-date | 4,688.7 | below |
| Level | Reference |
|---|---|
| 4,701.4 | third pivot resistance |
| 4,693.0 | 13-week high, larger swing objective |
| 4,674.3 | two-SD extension |
| 4,649.3 | second pivot resistance |
| 4,644 to 4,645 | one-SD band and 50% retracement |
| 4,627 to 4,629 | crossover zone and 200-day average |
| 4,610.3 | first pivot resistance |
| 4,600 to 4,604 | one-month high, momentum-70 and computed target |
| 4,571.4 | December settle |
| 4,558 to 4,568 | daily pivot and prior-low, entry band |
| 4,519.2 | first pivot support, stop shelf |
| 4,498.6 | first-SD support band |
| 4,467 to 4,469 | second pivot and two-SD support |
| 4,428.1 | third pivot support |
| 4,376.6 | 38.2% retracement, reversal only |
| Metric | Reading |
|---|---|
| Gold-ETF proxy last | 413.84, bid after hours |
| Call-side dealer gamma | about minus 296 million |
| Put-side dealer gamma | about plus 74 million |
| Net positioning | short gamma, moves get amplified |
| Implied-vol rank | about 38 percent |
| One-day implied move | about 1.5 percent, roughly 69 gold points |
| Nearby magnet strike | none, the positioning field is diffuse |
| Input | |
|---|---|
| Dollar index | 98.71, down 0.13%, a tailwind |
| 10-year yield | near 4.70%, firm, the headwind |
| Volatility index | 16.02, up 7.66% |
| Retail sales | minus 0.6% vs an expected gain |
| Payrolls | minus 23,000, outright weak |
| Crude | US benchmark up 2.33%, an inflation impulse |
| Silver | up 1.37% overnight, complex leadership |
| When | Event |
|---|---|
| Fri Aug 21 03:15-04:30 ET | European flash activity surveys, dollar tone |
| Fri Aug 21 08:30 ET | Canadian retail sales |
| Fri Aug 21 09:45 ET | US flash activity surveys, the decision point |
| Fri Aug 21 10:00 ET | Eurozone flash consumer confidence |
| September 16 | next policy statement, projections and press conference |
The economic releases referenced above are published on the official government calendars below. Price levels are derived from standard technical and statistical methods, and the market read is AlgoIndex's own analysis. How we grade these calls is set out in our performance methodology.
- US Census Bureau, New Residential Construction (housing starts and building permits)
- US Bureau of Labor Statistics, Import and Export Price Indexes
- Federal Reserve, Industrial Production and Capacity Utilization (G.17)
- Federal Reserve, FOMC calendar and meeting minutes
- US Department of the Treasury, auction schedule and results
- AlgoIndex performance methodology



