
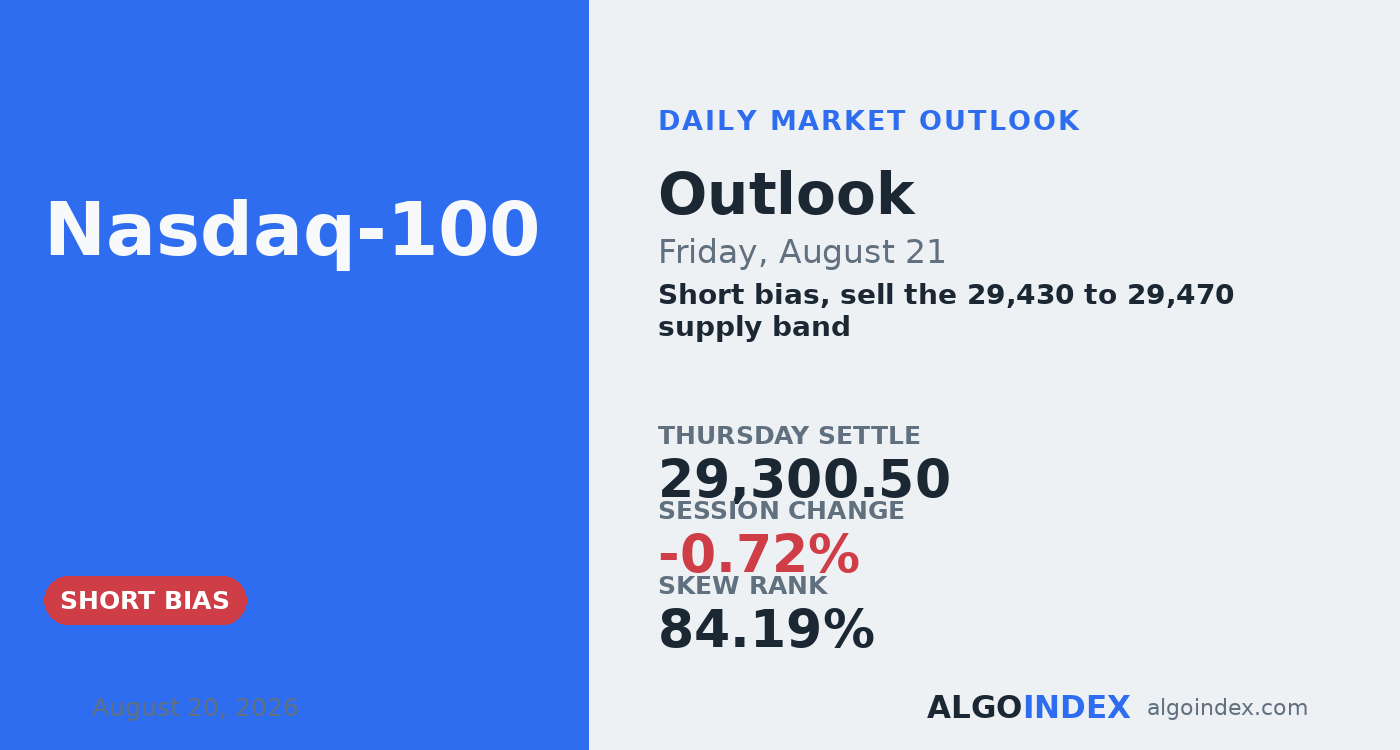
The Nasdaq 100 fell 0.72 percent on Thursday and closed at 29,300.50, down 212.25 points, in the bottom fifth of a 487 point range. That's a fourth straight lower close, and the slide from last Friday now runs to 841.25 points. What matters isn't the size of the day, it's the shape. The contract made its high early, distributed all through the cash session, tagged 29,202.75 late in the afternoon, then clawed back about 100 points into the bell.
The driver was the cost of money, not anything about earnings. A bond rally faded as long-end yields turned back up, unwinding the relief that had followed the Treasury's larger buyback plan, and crude above 85 dollars added a second squeeze on risk. The broad index fell 0.9 percent, so the Nasdaq actually held up a touch better than the market around it, which shows the selling sat in the longest-duration names rather than across the whole complex. After the close, word that a major chipmaker is chasing more than 60 billion dollars in debt for capacity wired a fresh rates channel straight into the AI buildout.
A bounce arriving into supply
The overnight recovery is real, but it's shallow. Price is holding above the 20-day at 29,259 after piercing it and reclaiming it in a single session, which keeps the medium-term uptrend technically alive, and the nine-day stochastic near 12 is stretched enough to power a bounce. The trouble is where that bounce runs out of room. The 5-day at 29,569 and the 50-day at 29,517 now sit overhead as confirmed supply, and the current lift has only retraced about 30 percent of Thursday's range without reaching the first real resistance band.
Underneath, the mechanics lean the other way. The index proxy is carrying negative dealer gamma while the broad market carries positive gamma, and that's the reason the Nasdaq produced a cleaner one-way afternoon than the broad market did. The cash index closed about 138 points below its modeled dealer gamma flip level, so the complex sits on the amplifying side of that boundary. Friday's monthly expiration then retires a large block of the stabilising positioning that's been soaking up sell flow all week, and once it rolls off the market can move more freely.
One survey decides the day
The whole session hinges on a single print. The US flash activity surveys land at 09:45 ET, and since Thursday's fall was purely a yield story, the index reaction to that number is the day. A composite above 54.5 pushes yields up and pressures price straight into the short; a reading below 53 eases yields but raises growth worries, which for the Nasdaq is usually the softer of the two outcomes. Above 29,398 the bounce is trying to reach the 50-day; below 29,275 it's already failed and the 29,203 low is back in play. Between them, the right move is to wait.
Sell the retracement, respect the 50-day
The plan sells the 29,430 to 29,470 supply band on the bounce, where the gamma flip boundary, the entry shelf and the overhead averages line up, rather than shorting into the hole beneath. The stop is 29,535, just above the 50-day at 29,517, so a sustained reclaim there breaks the lower-high sequence the thesis leans on and takes the trade out, about 85 points from the middle of the entry. Targets run to the 29,275 overnight low, then the 29,203 week low where the 29,187 gamma concentration adds density, then the 29,105 computed support if the expiration unpins the market. Half size, because Friday's expiration widens the outcomes both ways. There's a real override too: a US composite print well below consensus that drags yields down removes the exact mechanism behind Thursday's drop, and in that case the short stands down rather than gets defended. performance methodology sets out how we grade these calls.
The bounce is climbing into a wall of supply while dealer gamma sits short and the stabilising positioning is about to roll off. That's a market built to fade, as long as the 09:45 survey doesn't rewrite the yield story.
A shallow bounce into confirmed supply, on the amplifying side of the gamma flip, is a short worth taking. The whole trade is the 50-day at 29,517, and the 09:45 survey is the one thing that can undo it.
This is the read our members get every session, before the bell, with the levels drawn and the setup defined. See how the same dealer-positioning work turns into systematic signals.
View pricingThe complete data picture
Every number behind Friday’s plan, charted first; the full numeric reference follows underneath.
Full numeric reference, every remaining figure from the review
| Average | Value | Settle vs |
|---|---|---|
| 5-day | 29,569.45 | overhead by 268.95 |
| 20-day | 29,259.15 | 41.35 below, immediate support |
| 50-day | 29,516.94 | overhead by 216.44 |
| 100-day | 28,845.39 | 455.11 below, deeper support |
| 200-day | 27,265.07 | 2,035.43 below |
| Level | Reference |
|---|---|
| 29,884.67 | second-level computed resistance |
| 29,747.92 | two-SD band |
| 29,687 to 29,690 | volatility inflection, session high |
| 29,587 to 29,617 | computed resistance, gamma concentration confluence |
| 29,569.45 | 5-day average |
| 29,516.94 | 50-day, the consequential line |
| 29,438 | gamma flip boundary, entry edge |
| 29,430 to 29,470 | primary short entry, supply band |
| 29,367 to 29,398 | crossing band, first upside test |
| 29,300.50 | Thursday settle |
| 29,259.15 | 20-day, reclaimed and defended |
| 29,187 to 29,203 | week low and lower gamma concentration, target 2 |
| 29,105.58 | first computed support, target 3 |
| Metric | Reading |
|---|---|
| Proxy fund last | 711.10, down 0.70% |
| Total gamma notional | negative 209.97 million, short gamma |
| Broad-index gamma | positive 281.04 million, opposite sign |
| Gamma flip boundary | 29,438 futures, price below |
| Volatility inflection | 29,687 futures |
| Lower gamma concentration | 29,187 futures |
| Proxy put-to-call OI | 1.19, mild downside skew |
| Implied-vol rank | 29.25 percent |
| Skew rank | 84.19 percent |
| Input | |
|---|---|
| 10-year yield | reversed higher, unwinding the buyback relief |
| Dollar index | firmer as long-end yields turned up |
| WTI crude | above 85 dollars, a second squeeze on risk |
| Volatility index | 16.02, up 8% |
| Broad index | down 0.9%, the Nasdaq outperformed slightly |
| AI capex | a major chipmaker sought 60 billion-plus for capacity |
| Money-market assets | 7.93 trillion, no flight from risk |
| When | Event |
|---|---|
| Fri Aug 21 | US flash PMIs 09:45, monthly options expiration |
| Tue Aug 26 | monthly inflation reading and dominant chipmaker earnings |
| Aug 27-29 | central-bank symposium, chair speaks Aug 28 |
| Sep 16 | next policy decision with updated projections |
The economic releases referenced above are published on the official government calendars below. Price levels are derived from standard technical and statistical methods, and the market read is AlgoIndex's own analysis. How we grade these calls is set out in our performance methodology.
- US Census Bureau, New Residential Construction (housing starts and building permits)
- US Bureau of Labor Statistics, Import and Export Price Indexes
- Federal Reserve, Industrial Production and Capacity Utilization (G.17)
- Federal Reserve, FOMC calendar and meeting minutes
- US Department of the Treasury, auction schedule and results
- AlgoIndex performance methodology



