
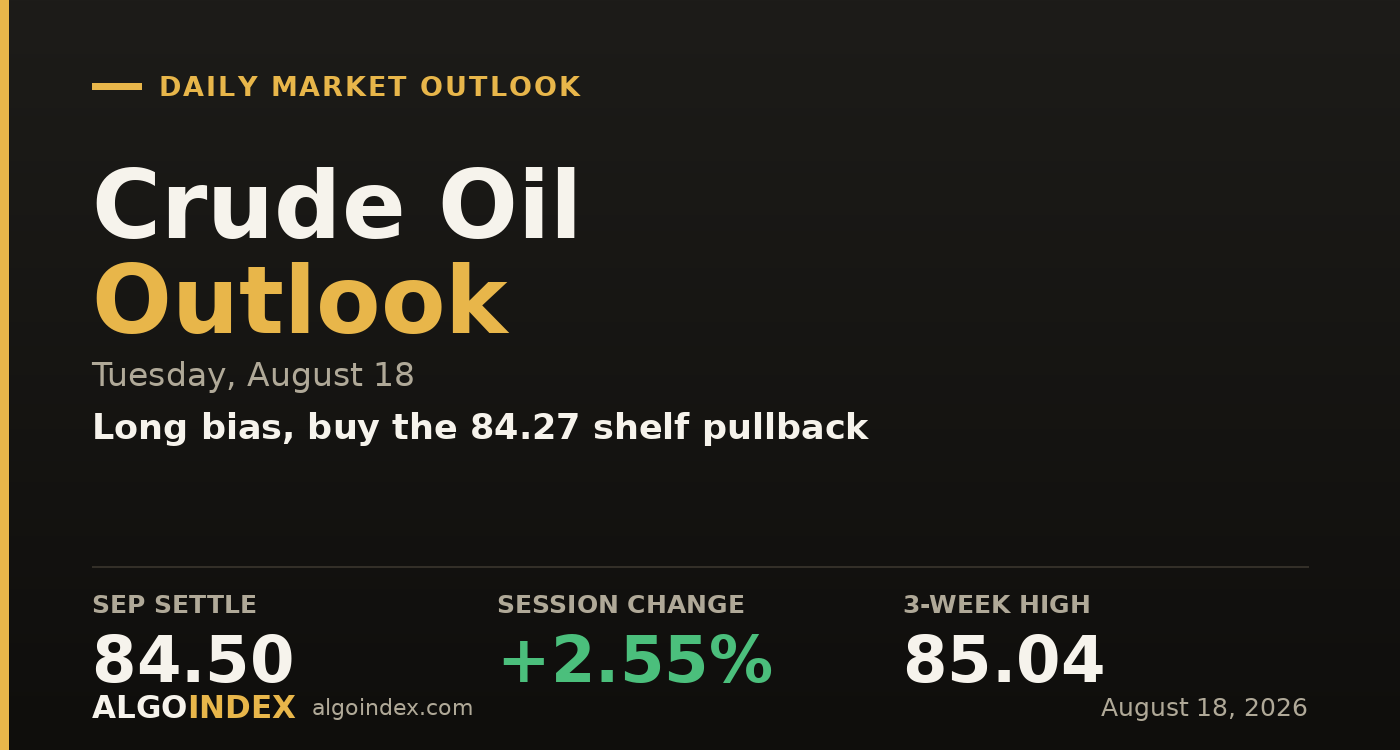
September crude settled at 84.50, higher by 2.55 percent and the strongest close in three weeks. The session was a one-way move after a slow start: crude opened at 82.53, probed to an 81.50 low in the first hours, then reversed hard and ground to an 85.04 high through the afternoon. The 3.54 range used roughly 91 percent of the fourteen-day average, a large day by recent standards but not an outlier. Volume told the other side of the story, at 160,000 contracts against a 20-day average near 289,000, only 56 percent of normal participation. That gap matters.
The more telling detail came after the settlement. Crude settled at 84.50 at 14:30 ET, but the post-settlement session kept bidding and closed 44 cents higher at 84.94. That gap isn't a rounding artifact, it's the market's verdict after the print. The reason it matters is the sequence of the headlines: the escalatory comments crossed before the settle, and the conciliatory ones landed after, near 15:04 ET, when a US envoy described talks with Tehran as more constructive than they have ever been. Crude was handed the de-escalation narrative and bought anyway.
A recovery rally that hasn't been accepted
The short-term technical picture improved genuinely on Monday. Spot trades above every major moving average, the directional index is accelerating with positive direction leading on all five windows, and the multi-indicator composite reads a 64 percent buy. Speculative shorts built into the early-August lows are underwater, and that provides covering fuel on any push higher. For a market that spent weeks correcting, this is the most constructive it has looked.
The longer picture hasn't repaired, and that's the tension. The fifty-day price change is still negative, the hundred-day average sits above the fifty-day, and that crossover is the single outright sell in the composite. This is a recovery inside a larger corrective phase that began at the May high, not a resumption of trend. Layer on the nine-day stochastic pinned at 99.8 while fourteen-day relative strength is only 57, and the result is a market at the very top of a narrow recent range that hasn't travelled far in the broader context. The thin volume says the same thing: price has moved, but it hasn't been accepted here yet.
Moved, but not yet accepted
The volume profile is the argument for patience. Crude's electronic close pushed above the three standard deviation level at 84.69 on 56 percent of average participation, while the official settlement at 84.50 held just beneath it, and 41 percent of the day's business was transacted more than two dollars lower. Those two facts describe a market that has run but hasn't settled into the new prices. The physical complex supports the move, Brent holding a 6.37 premium over the WTI contract and refining margins firm, but the September contract expires Thursday and liquidity is already migrating to October, which drains front-month volume mechanically. Both readings, thin conviction or thin expiry, argue the same way: wait for the pullback rather than chase the high.
Buy the shelf, not the high
The plan buys a pullback into the 84.27 to 84.50 shelf, the three-way confluence that stacks the two standard deviation level, the second pivot and the stochastic threshold, with confirmation of absorption rather than a falling-knife catch. The stop sits at 83.60, below the one standard deviation level, roughly 0.70 to 0.90 of risk. Targets run to the 85.04 high, then the 85.48 to 85.64 crossover shelf where most of the position comes off, then the 86.14 retracement on escalation follow-through. The ratio to the first target is modest, the unavoidable cost of a tight stop under close resistance, and the trade earns its keep at the second. A fifteen-minute close below 83.72 voids it, and any credible Hormuz reopening headline overrides the structure entirely. performance methodology sets out how we grade the result.
Crude was offered the de-escalation story after the settle and bought anyway. That's a strong tell, but the electronic close pushed above the three standard deviation level on 56 percent of average volume, so the trade is the pullback, not the chase.
A market can be genuinely stronger in the short term and still sit inside a larger correction. The long is the 84.27 shelf on a pullback, with the stop that keeps the recovery thesis intact.
This is the read our members get every session, before the bell, with the levels drawn and the setup defined. See how the same dealer-positioning work turns into systematic signals.
View pricingThe complete data picture
Every number behind Tuesday’s plan, charted first; the full numeric reference follows underneath.
Full numeric reference, every remaining figure from the review
| Average | Value | Settle vs |
|---|---|---|
| 5-day | 83.00 | spot above by 1.94 |
| 20-day | 82.56 | above by 2.38 |
| 50-day | 78.61 | above by 6.33 |
| 100-day | 81.57 | above by 3.37 |
| 200-day | 72.07 | above by 12.87 |
| Year-to-date | 75.93 | spot above |
| Level | Reference |
|---|---|
| 85.64 | third pivot / crossover shelf |
| 85.48 | 3-10 day crossover stall |
| 85.19 | 1.272 extension |
| 85.04 | session high, three-week extreme |
| 84.69 | three-SD resistance |
| 84.50 | settle |
| 84.27 to 84.34 | three-way support shelf |
| 83.00 | 5-day average |
| 82.56 | 20-day average |
| 82.30 | 41% intraday volume node |
| 82.03 to 82.07 | pivot / 18-day confluence |
| 81.50 | session low |
| 74.23 | one-month low, base of recovery |
| Metric | Reading |
|---|---|
| Brent-WTI differential | 6.37 (Brent 90.87 vs WTI 84.50) |
| Gasoline crack | roughly 52.84 per barrel |
| Distillate crack | roughly 101.86 per barrel |
| Blended 3-2-1 margin | near 69 dollars |
| Listed options surface | not available for crude |
| Cohort | Weekly change |
|---|---|
| Commercials | net short 129,637; shorts -14,319 |
| Non-commercials | net long 99,196; shorts +19,252 |
| Managed money | net long 79,916; longs +1,036 |
| Swap dealers | short 578,142, down 18,146 |
| Producers | long 658,494 up 15,715 (as of Aug 11) |
| Input | |
|---|---|
| Retail sales | minus 0.6% (forecast plus 0.1%) |
| Non-farm payrolls | minus 23,000 (forecast 80,000) |
| Weekly crude inventories | build of 17.4 million barrels |
| Dollar index | 99.57, near a two-month low |
| 10-year yield | 4.720, up 0.53% |
| Brent settle | 90.87, up 2.65% |
| Natural gas | 2.6900, down 1.57%, one-week low |
| When | Event |
|---|---|
| Tue Aug 18 | data-light; industrial production 09:15 is the key demand proxy |
| Wed Aug 19 | inventories 10:30, 20-yr auction 13:00, Fed minutes 14:00 |
| Thu Aug 20 | jobless claims, regional manufacturing; September expiry |
The economic releases referenced above are published on the official government calendars below. Price levels are derived from standard technical and statistical methods, and the market read is AlgoIndex's own analysis. How we grade these calls is set out in our performance methodology.
- US Census Bureau, New Residential Construction (housing starts and building permits)
- US Bureau of Labor Statistics, Import and Export Price Indexes
- Federal Reserve, Industrial Production and Capacity Utilization (G.17)
- Federal Reserve, FOMC calendar and meeting minutes
- US Department of the Treasury, auction schedule and results
- AlgoIndex performance methodology



