
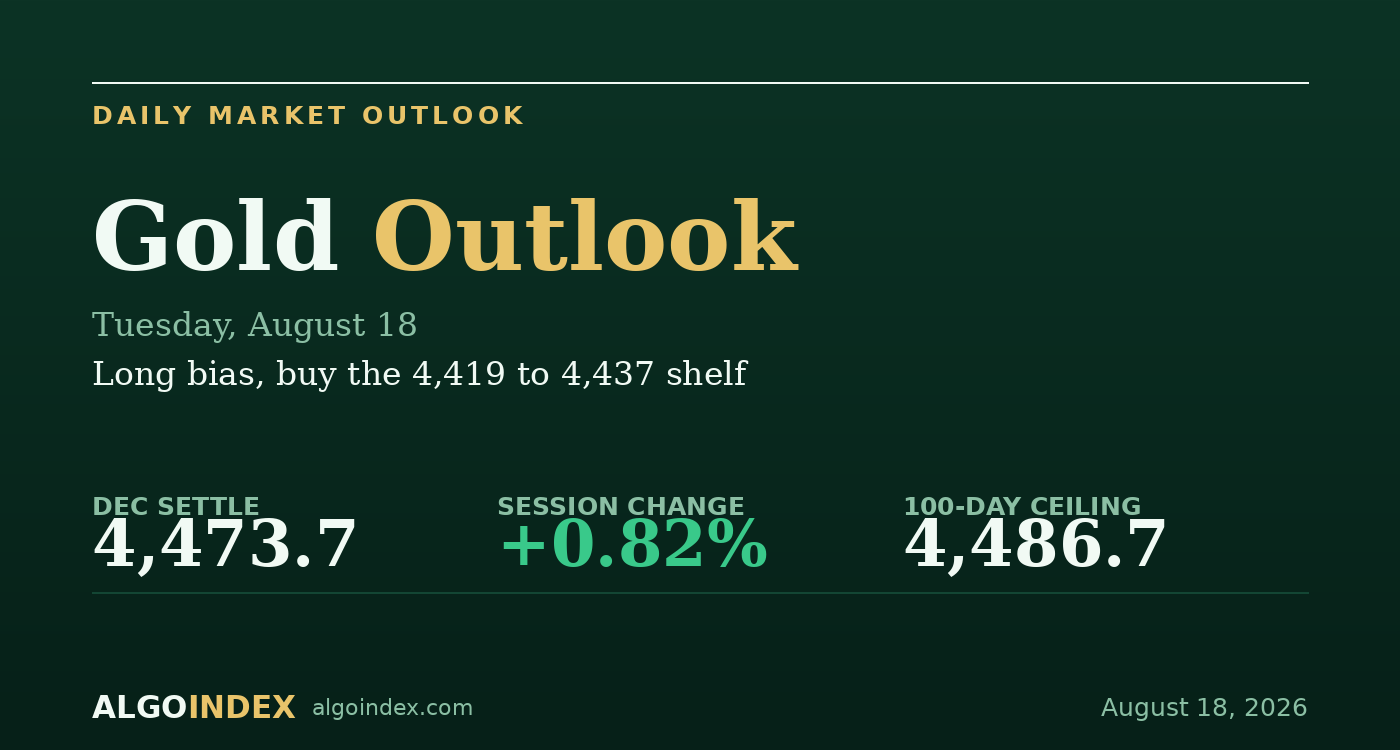
Gold closed Monday firmly higher, with the December contract settling near 4,473.7, a gain of about 36 points or 0.82 percent. The metal opened at 4,440, pressed straight to a 4,486.5 high, then eased back through the afternoon to hold the upper half of the day's range into the close. Turnover near 118,000 contracts fit a trending, headline-driven session rather than a thin drift. This was a clean advance, not a squeeze.
The driver was a fresh escalation in Middle East risk. A senior Iranian official was reported mid-morning to have shifted the country's posture to a fully offensive one, and that headline landed alongside renewed pressure around the Strait of Hormuz and a weekend strike on a Saudi refinery. The result was a broad safe-haven bid that also carried Brent above 90 dollars. Reinforcing it, the dollar sagged to two-month lows and a soft run of US data, a 0.6 percent drop in retail sales and a negative payrolls print, kept the market leaning toward an easier path from the central bank. Everything gold needed was in place, except a clear break of the ceiling directly overhead.
An advance into a ceiling
The trend reading is unambiguous. Price holds above the five, twenty and fifty-day averages, the directional index is strengthening with positive direction dominant at 27 against 11 on the nine-day, and dealer positioning favours continuation. The safe-haven catalyst is live and the macro backdrop is supportive, a weak dollar and a market that expects easier policy. That is the constructive case, and it's a strong one while the headlines keep crossing.
The counterweight is simple. It's the wall directly above the market. Price is capped beneath the hundred-day average at 4,486.7, which is almost exactly where Monday's high was rejected. Short-term momentum is stretched too, with nine-day relative strength near 72 and the stochastic pinned above 90. None of that is a reversal signal, but it's the reason the metal has to clear the 4,486 to 4,494 band before the next leg can extend, and why chasing straight into the ceiling isn't the trade. The higher-quality entry waits for a pullback.
The ceiling is the whole story
The ceiling is the whole trade. Everything about Tuesday runs through the hundred-day average. Below it, the metal is a buy-the-dip market with a safe-haven bid keeping declines shallow. Through it, the path opens to the 4,508 second pivot and the one-month high, then the 4,558 grouping above. The options proxy shows dealer positioning that isn't richly priced, an implied-volatility rank near 27 and a call-heavy put-to-call ratio near 0.47, so the market isn't paying up for protection even with the tension in the headlines. The risk to the whole picture is a de-escalation print or a hot import-prices number that lifts front-end yields and the dollar at the same time.
Buy the shelf, or the ceiling break
The primary plan buys strength on a controlled pullback into the 4,419 to 4,437 shelf, the daily pivot up to the prior close, rather than chasing into the wall. The stop sits below 4,398, beneath the round-number base and the one standard deviation support, roughly 30 points of risk. Targets run to the 4,472 underside of the ceiling, then the 4,508 second pivot and one-month high, then the 4,558 grouping. There is a second way in. A decisive reclaim of the 4,494 ceiling that holds targets 4,508, then 4,561, with a stop set back below 4,472. A sustained close beneath 4,383 breaks the near-term structure, and a confirmed de-escalation headline cuts the safe-haven premium and argues for standing aside. performance methodology explains how we grade both paths.
Gold has the story, the trend and the bid. What it doesn't have yet is the hundred-day average, and until it clears 4,494 the highest-quality trade is the pullback, not the chase.
A strong trend into a hard ceiling is a buy on weakness, not a buy at the wall. The pullback into 4,437 pays better than the breakout, and it risks less.
This is the read our members get every session, before the bell, with the levels drawn and the setup defined. See how the same dealer-positioning work turns into systematic signals.
View pricingThe complete data picture
Every number behind Tuesday’s plan, charted first; the full numeric reference follows underneath.
Full numeric reference, every remaining figure from the review
| Average | Value | Settle vs |
|---|---|---|
| 5-day | 4,447.5 | price above |
| 20-day | 4,254.4 | well above |
| 50-day | 4,226.9 | above |
| 100-day | 4,486.7 | just below, immediate ceiling |
| 200-day | 4,621.9 | below |
| Year-to-date | 4,692.7 | below |
| Level | Reference |
|---|---|
| 4,693.0 | 13-week high |
| 4,621.9 | 200-day average |
| 4,561.9 | third pivot resistance |
| 4,509.1 | 1-month high |
| 4,508.2 | second pivot resistance |
| 4,493.9 | average crossover stall |
| 4,486.7 | 100-day average ceiling |
| 4,473.7 | December settle |
| 4,437.3 | prior close shelf |
| 4,419.1 | daily pivot |
| 4,400.0 | round / three-SD support |
| 4,383.7 | first pivot support |
| Metric | Reading |
|---|---|
| Gold-ETF proxy last | 405.03, up 0.90% from 401.43 |
| Net dealer positioning | about minus 331 million notional |
| Call-side reading | about minus 445 million |
| Put-side reading | about plus 114 million |
| Put-to-call OI ratio | about 0.47, call-heavy |
| Implied-vol rank | about 27 percent |
| Heaviest dealer expiry | September 17 monthly |
| One-session implied move | about 5.46 dollars, 1.35 percent |
| Input | |
|---|---|
| Core CPI (mid-month) | plus 0.2% monthly, in line |
| Retail sales | minus 0.6% vs a small expected gain |
| Payrolls (early Aug) | minus 23,000, negative |
| US dollar | two-month lows |
| 30-year Treasury yield | highest since 2007 |
| Brent crude | above 90 dollars, up 2.65% |
| When | Event |
|---|---|
| Tue 08:30 ET | permits, starts, import prices |
| Tue 09:15 ET | industrial production |
| Tue 10:00 ET | pending home sales |
| Wed 14:00 ET | Federal Reserve meeting minutes |
| Thu 08:30 ET | jobless claims, Philadelphia index |
| Fri | global flash purchasing-managers surveys |
The economic releases referenced above are published on the official government calendars below. Price levels are derived from standard technical and statistical methods, and the market read is AlgoIndex's own analysis. How we grade these calls is set out in our performance methodology.
- US Census Bureau, New Residential Construction (housing starts and building permits)
- US Bureau of Labor Statistics, Import and Export Price Indexes
- Federal Reserve, Industrial Production and Capacity Utilization (G.17)
- Federal Reserve, FOMC calendar and meeting minutes
- US Department of the Treasury, auction schedule and results
- AlgoIndex performance methodology



