
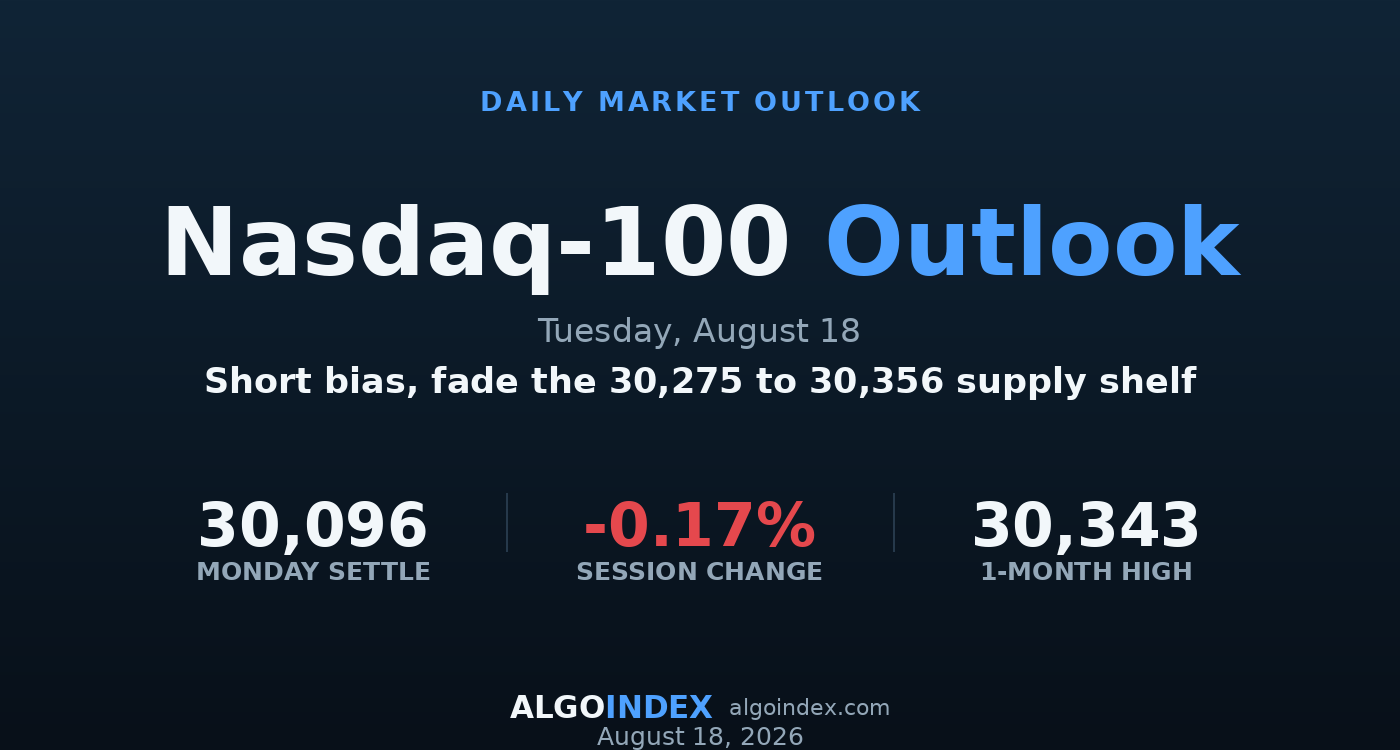
The number that matters isn't the change, it's the shape. The September Nasdaq-100 settled at 30,096, lower by only 0.17 percent, but it got there by printing a fresh one-month high at 30,343 and then surrendering the entire advance to close 41 points off the session low. The full range measured 288 points and the contract finished in the bottom 14 percent of it. A market that makes a new high and closes near the low of the day isn't distributing quietly. It's being sold into strength.
The rejection has a cause and an address. The cause was the same channel that has governed this market for weeks: crude pushing higher, feeding inflation expectations, feeding long-end yields, feeding pressure on long-duration growth. The ten-year added three basis points to 4.72 percent as Brent cleared 90 dollars. The address was the call-side dealer concentration near 30,300 in the futures, and the high at 30,343 poked just beyond it and turned away inside the hour. Semiconductors did the heavy lifting on the day, which is why the index fell a third as much as the broad market, but leadership that narrow with hedging demand rising underneath it is a strong story with thin breadth.
A new high sold, and a magnet held
The internal composition of Monday was constructive while the outcome wasn't, and that contradiction defines Tuesday. Memory and equipment names ran between 2 and 9 percent, the index outperformed the broad market decisively, and price still sits above every moving average with the directional index accelerating as the window shortens. The structural line is the settle itself at 30,096, which pins within a handful of points of the primary dealer concentration for the index. Above it, the market is rotational and magnetic.
What turned is the near term. The nine-day stochastic has rolled beneath its signal, the short-term tier of the composite is the weakest of the three, and the broad market closed beneath its own pivot for the first time in this run. Monday's Nasdaq hedging flow ran to negative 3 billion of delta, dominated by longer-dated call selling, and that is the mechanism that produced the reversal, still in force. Software was carved out even as chips led, with several large enterprise names down 3 percent or more, and the volatility index woke to 15.18, up roughly 7 percent from Friday's yearly low. It doesn't take much to turn a pinned market once the hedging flips.
Pinned to the magnet, capped at the shelf
Dealer positioning describes the whole session. The primary concentration equivalent sits at the settle, which is why price gravitated back to 30,096 after the rejection, and the four-way supply shelf from 30,333 to 30,356 is where Monday's high failed. Skew rank sits in the 96th percentile against an implied-volatility rank near 23, so downside protection is bid while outright option pricing is cheap, and the index carries the most call-heavy dealer tilt of the major benchmarks. That last point cuts both ways: it pins the market on quiet days, and it fuels a squeeze if the shelf ever gives.
Fade the shelf, respect the squeeze
The plan sells a failed retest of the 30,275 to 30,340 supply shelf, the same location that turned the market away on Monday and that stacks the one standard deviation band with a moving-average stall inside a 24-point span. The stop sits at 30,385, above the 30,356 crossover and Monday's high, and the targets run to the 30,164 daily pivot, then the 30,096 magnet, then the 29,986 pivot support reinforced by the five-day average. It isn't a trade to hold blindly. Speculative accounts carry a net short near 89,000 contracts, so a genuine break of the shelf can run faster than the level map suggests, and a de-escalation headline that pulls Brent back under 90 dollars voids the short at any price. performance methodology covers how we score the outcome.
A one-month high that closes in the bottom 14 percent of the day is not a breakout, it's a rejection with a timestamp. The shelf that turned it is the shelf we fade, until two closes above it prove otherwise.
The tilt is short, but the same call-heavy positioning that pins this market is the fuel for a squeeze. That's why the stop sits above the shelf, not inside it.
This is the read our members get every session, before the bell, with the levels drawn and the setup defined. See how the same dealer-positioning work turns into systematic signals.
View pricingThe complete data picture
Every number behind Tuesday’s plan, charted first; the full numeric reference follows underneath.
Full numeric reference, every remaining figure from the review
| Average | Value | Settle vs |
|---|---|---|
| 5-day | 29,981.10 | above by 114.90 |
| 20-day | 29,141.60 | above by 954.40 |
| 50-day | 29,507.54 | above by 588.46 |
| 100-day | 28,618.07 | above by 1,477.93 |
| 200-day | 27,208.38 | above by 2,887.62 |
| Year-to-date | 27,525.68 | above |
| Level | Reference |
|---|---|
| 31,100.00 | 52-week and 13-week high, Jun 3 |
| 30,333 to 30,356 | primary supply shelf, four-way, Monday rejection |
| 30,274.50 | first pivot resistance |
| 30,164 to 30,209 | pivot band, first overhead |
| 30,096.00 | settle, primary dealer magnet |
| 29,986.00 | first pivot support, 5-day at 29,981 |
| 29,859 to 29,900 | primary demand band, four-way |
| 29,570 | fragility line, hedging flips to amplifying |
| 27,201.50 | 1-month and 13-week low, Jul 29 |
| Metric | Reading |
|---|---|
| Dealer hedging flow | minus 3 billion delta, longer-dated call selling |
| Call-side concentration | about 30,300 futures, rejected Monday |
| Primary magnet strike | about 30,100 futures |
| Secondary strike | about 29,900 futures |
| Fragility line | about 29,570 futures, hedging amplifies below |
| Put-side concentration | about 29,200 futures |
| Call tilt vs majors | 1.605, most call-heavy of the indices |
| Skew rank vs IV rank | 95.65th vs 23.52% |
| Cohort | Weekly change |
|---|---|
| Leveraged funds | net short 89,125, both sides reduced |
| Non-commercial | net short 39,302, shorts +12,477 |
| Asset managers | net long 61,665 |
| Commercial | modestly net long 17,475 |
| Dealers | marginally net long 2,897 |
| Input | |
|---|---|
| 10-year yield | 4.72%, up three basis points |
| WTI crude | 84.36, Brent above 90, three-week high |
| Dollar index | 99.580, down 0.06% |
| Volatility index | 15.18, up 6.45% |
| July payrolls | minus 23,000 vs plus 80,000 expected |
| Retail sales | minus 0.6% vs plus 0.1% expected |
| When | Event |
|---|---|
| Tue Aug 18 | data-light, second-order housing and production |
| Wed Aug 19 | inventories 10:30, 20-yr auction 13:00, Fed minutes 14:00, vol expiration |
| Thu Aug 20 | jobless claims, Philadelphia survey |
| Fri Aug 21 | flash PMIs 09:45, monthly options expiration |
| Wed Aug 26 | largest chipmaker earnings |
| Aug 27-29 | central-bank symposium |
The economic releases referenced above are published on the official government calendars below. Price levels are derived from standard technical and statistical methods, and the market read is AlgoIndex's own analysis. How we grade these calls is set out in our performance methodology.
- US Census Bureau, New Residential Construction (housing starts and building permits)
- US Bureau of Labor Statistics, Import and Export Price Indexes
- Federal Reserve, Industrial Production and Capacity Utilization (G.17)
- Federal Reserve, FOMC calendar and meeting minutes
- US Department of the Treasury, auction schedule and results
- AlgoIndex performance methodology



